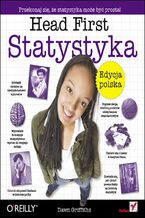
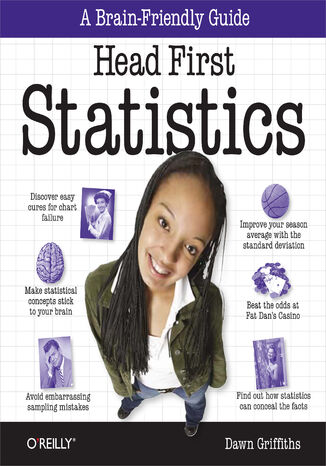
Head First Statistics. A Brain-Friendly Guide Dawn Griffiths

- Autor:
- Dawn Griffiths
- Ocena:
- Bądź pierwszym, który oceni tę książkę
- Stron:
- 718
- Dostępne formaty:
-
ePubMobi
Opis
książki
:
Head First Statistics. A Brain-Friendly Guide
Wouldn't it be great if there were a statistics book that made histograms, probability distributions, and chi square analysis more enjoyable than going to the dentist? Head First Statistics brings this typically dry subject to life, teaching you everything you want and need to know about statistics through engaging, interactive, and thought-provoking material, full of puzzles, stories, quizzes, visual aids, and real-world examples.
Whether you're a student, a professional, or just curious about statistical analysis, Head First's brain-friendly formula helps you get a firm grasp of statistics so you can understand key points and actually use them. Learn to present data visually with charts and plots; discover the difference between taking the average with mean, median, and mode, and why it's important; learn how to calculate probability and expectation; and much more.
Head First Statistics is ideal for high school and college students taking statistics and satisfies the requirements for passing the College Board's Advanced Placement (AP) Statistics Exam. With this book, you'll:
- Study the full range of topics covered in first-year statistics
- Tackle tough statistical concepts using Head First's dynamic, visually rich format proven to stimulate learning and help you retain knowledge
- Explore real-world scenarios, ranging from casino gambling to prescription drug testing, to bring statistical principles to life
- Discover how to measure spread, calculate odds through probability, and understand the normal, binomial, geometric, and Poisson distributions
- Conduct sampling, use correlation and regression, do hypothesis testing, perform chi square analysis, and more
Before you know it, you'll not only have mastered statistics, you'll also see how they work in the real world. Head First Statistics will help you pass your statistics course, and give you a firm understanding of the subject so you can apply the knowledge throughout your life.
Wybrane bestsellery
-
Nowość Promocja Promocja 2za1
Zdobywczyni HUGO 2024 i wielu innych nagród Druga najchętniej wybierana na prezent książka w układzie słonecznym NIEZIEMSKA i zabawna opowieść o perspektywach kosmicznego osadnictwa spod pióra autorów bestsellera JAKOŚ WKRÓTCE ze świetnymi ilustracjami Zacha Weinersmitha * Czy można rozmnażać się na Marsie? Czy lepiej żyć tam niż na Ziemi po wojnie- ePub + Mobi 29 pkt
(35,99 zł najniższa cena z 30 dni)
29.99 zł
39.99 zł (-25%) -
Nowość Promocja Promocja 2za1
Matematyka dyskretna to podstawa współczesnej informatyki. Bez niej nie istniałyby nowoczesne systemy kryptograficzne, algorytmy sztucznej inteligencji ani wyszukiwarki internetowe. Jej znajomość pozwala zrozumieć, jak działają struktury danych czy zabezpieczenia cyfrowe, w tym kryptografia RSA, oparta na trudności faktoryzacji dużych liczb pierwszych. Matematyka dyskretna stanowi wspólny język dla specjalistów z różnych dziedzin IT – od programistów i analityków danych po kryptografów i badaczy AI. Zagadnienia takie jak kombinatoryka, teoria liczb czy zasada szufladkowa Dirichleta uczą logicznego myślenia i skutecznego rozwiązywania problemów. Znajomość tych koncepcji, połączona z umiejętnością ich implementacji w języku Python, daje realną przewagę na rynku pracy. Potwierdzają to giganci branży technologicznej – Google, Facebook czy Amazon. Firmy te korzystają z narzędzi matematyki dyskretnej do optymalizacji wyszukiwań, personalizacji reklam i przetwarzania ogromnych zbiorów danych. Z naszym szkoleniem zrozumiesz podstawy teorii liczb, kombinatoryki, logiki i arytmetyki modularnej, które prędzej czy później okażą się niezbędne w realnych projektach. Bez względu na to, czy jesteś studentem informatyki, tworzysz algorytmy, analizujesz dane, zabezpieczasz systemy lub budujesz modele uczenia maszynowego, wiedza ta dostarczy Ci narzędzi do rozwiązywania złożonych problemów i rozwoju kariery w branży IT.- Videokurs 174 pkt
(39,90 zł najniższa cena z 30 dni)
174.30 zł
249.00 zł (-30%) -
Promocja Promocja 2za1
Koncepcje te zostały przystępnie wyjaśnione właśnie w tej książce. W szczególności zapoznasz się z praktycznymi aspektami probabilistyki, statystyki, algebry liniowej i rachunku różniczkowego. Prezentacji tych zagadnień towarzyszą fragmenty kodu w Pythonie i praktyczne przykłady zastosowań w uczeniu głębokim. Rozpoczniesz od zapoznania się z podstawami, takimi jak twierdzenie Bayesa, a następnie przejdziesz do bardziej zaawansowanych zagadnień, w tym uczenia sieci neuronowych przy użyciu wektorów, macierzy i pochodnych. Dwa ostatnie rozdziały dadzą Ci szansę użycia nowej wiedzy do zaimplementowania propagacji wstecznej i metody gradientu prostego — dwóch podstawowych algorytmów napędzających rozwój sztucznej inteligencji.- Druk 44 pkt
(44,50 zł najniższa cena z 30 dni)
44.50 zł
89.00 zł (-50%) -
Promocja Promocja 2za1
To książka przeznaczona dla osób, które chcą dobrze zrozumieć matematyczne podstawy nauki o danych i nauczyć się stosowania niektórych koncepcji w praktyce. Wyjaśniono tu takie zagadnienia jak rachunek różniczkowy i całkowy, rachunek prawdopodobieństwa, algebra liniowa i statystyka, pokazano także, w jaki sposób posługiwać się nimi w regresji liniowej, regresji logistycznej i w tworzeniu sieci neuronowych. Poszczególne tematy zostały omówione zrozumiale, przystępnie, bez naukowego żargonu, za to z licznymi praktycznymi przykładami, co dodatkowo ułatwia przyswojenie koncepcji i prawideł matematyki. Opanowanie zawartej tu wiedzy pozwala uniknąć wielu kosztownych błędów projektowych i trafniej wybierać optymalne rozwiązania!- PDF + ePub + Mobi
- Druk 34 pkt
(34,50 zł najniższa cena z 30 dni)
34.50 zł
69.00 zł (-50%) -
Promocja Promocja 2za1
Ten podręcznik jest przeznaczony dla osób, które chcą dobrze zrozumieć matematyczne podstawy uczenia maszynowego i nabrać praktycznego doświadczenia w używaniu pojęć matematycznych. Wyjaśniono tutaj stosowanie szeregu technik matematycznych, takich jak algebra liniowa, geometria analityczna, rozkłady macierzy, rachunek wektorowy, optymalizacja, probabilistyka i statystyka. Następnie zaprezentowano matematyczne aspekty czterech podstawowych metod uczenia maszynowego: regresji liniowej, analizy głównych składowych, modeli mieszanin rozkładów Gaussa i maszyn wektorów nośnych. W każdym rozdziale znalazły się przykłady i ćwiczenia ułatwiające przyswojenie materiału.- Druk 64 pkt
(64,50 zł najniższa cena z 30 dni)
64.50 zł
129.00 zł (-50%) -
Promocja Promocja 2za1
Ta książka opiera się na wyjątkowej koncepcji — jest wspólnym dziełem nauczyciela zafascynowanego astronomią, fizyką, filozofią i muzyką oraz młodego geniusza matematycznego o wybitnym umyśle. Nie brakuje tu trudnych zagadnień, jednak każde zostało przystępnie wyjaśnione. Niektóre z poruszonych tematów są powiązane z technologią i nauką, inne można określić jako wyprawę w nieznane obszary matematyki i... umysłu człowieka. Publikacja pozwala spojrzeć na królową nauk z niecodziennej perspektywy. Ułatwia zrozumienie nieoczywistych zasad rządzących tą dziedziną, ale przede wszystkim dostrzeżenie jej ścisłych związków z otaczającą rzeczywistością i ideami drzemiącymi w ludzkich umysłach.- PDF + ePub + Mobi
- Druk 24 pkt
(24,95 zł najniższa cena z 30 dni)
24.95 zł
49.90 zł (-50%) -
Promocja Promocja 2za1
Książka dedykowana wszystkim przegranym Kiedy na świecie żyje ponad 7 mld osób, osobne rozpatrzenie każdego wniosku kredytowego, aplikacji na studia czy ocena indywidualnego pracownika staje się niemożliwa. By przetworzyć taką ilość danych, firmy korzystają z algorytmów. Niezależne i wolne od uprzedzeń, mają tylko jedno zadanie: wskazać poprawny, obiektywny i właściwy wynik. Problem polega na tym, że te algorytmy pisane są przez ludzi, a ci bardzo rzadko bywają obiektywni. Zaprojektowane przez nich narzędzia zamiast opisywać świat, kreują rzeczywistość zgodnie z tym, w co wierzy ich stwórca. To właśnie Broń Matematycznej Zagłady BMZ ten szczególny rodzaj algorytmu, który działa poza prawem i zasięgiem naszego wzroku. Z ich powodu parabanki pogrążają ubogich i zdesperowanych, słabo wykształceni kończą na uczelniach, których dyplomy nie mają żadnej wartości, a osoby ubiegające się o pracę wypełniają kwestionariusze, których precyzji pozazdrościłby niejeden psychoterapeuta. Cathy ONeil podąża tropem przegranych i skrzywdzonych, odkrywając kolejne Beemzety wszędzie: na uczelniach i w szkołach, w sieciowych restauracjach, służbie zdrowia, internetowych agencjach reklamowych, bankach, towarzystwach ubezpieczeniowych, policji, mediach społecznościowych czy podczas kampanii wyborczych- ePub + Mobi 44 pkt
(44,80 zł najniższa cena z 30 dni)
44.80 zł
64.00 zł (-30%) -
Nowość Promocja Promocja 2za1
Description The field of the IoT is fundamentally reshaping how physical objects interact with digital systems through enhanced connectivity and embedded intelligence. This book serves as an indispensable resource, guiding readers through the essential principles and techniques required to unlock the full potential of IoT. From foundational concept-
- ePub + Mobi 85 pkt
(85,49 zł najniższa cena z 30 dni)
85.49 zł
94.99 zł (-10%) -
-
Nowość Promocja Promocja 2za1
Description Microsoft security technologies provide a robust, integrated defense against evolving cyber threats, spanning identity, endpoints, applications, and data across hybrid environments. It offers a unified and intelligent defense across an organization's digital landscape. This book will introduce readers to Microsoft security solutions. It-
- ePub + Mobi 85 pkt
(85,49 zł najniższa cena z 30 dni)
85.49 zł
94.99 zł (-10%) -
O autorze książki
Dawn Griffiths jest znakomitą i bardzo doświadczoną programistką oraz autorką wielu książek z serii Rusz głową!. Wraz z mężem Davidem opracowała także animowany kurs wideo The Agile Sketchpad, stanowiący próbę uczenia kluczowych pojęć i technik w sposób zapewniający aktywną pracę mózgu i utrzymanie zaangażowania. Jej pasje to tai chi, bieganie i gotowanie.
Dawn Griffiths - pozostałe książki
-
Promocja Promocja 2za1
Najważniejsze zagadnienia zostały tu zilustrowane za pomocą — nierzadko zabawnych — przykładów z życia codziennego, takich jak analiza statystyk sportowych, wyników gier hazardowych czy testów nowych leków. Dzięki tej książce dowiesz się m.in., jak wybrać optymalny wykres do wizualizacji określonych danych, szybko wskazać wartości reprezentatywne dla danego zbioru danych i za pomocą rachunku prawdopodobieństwa przewidywać skutki powtarzalnych zdarzeń w długich seriach. Z łatwością nie tylko przyswoisz zawartą tu wiedzę, ale i wykorzystasz ją w codziennym życiu!- Druk 34 pkt
(34,50 zł najniższa cena z 30 dni)
34.50 zł
69.00 zł (-50%) -
Promocja Promocja 2za1
Filled with tips, tricks, and techniques, this easy-to-use book is the perfect resource for intermediate to advanced users of Excel. You'll find complete recipes for more than a dozen topics covering formulas, PivotTables, charts, Power Query, and more. Each recipe poses a particular problem and outlines a solution that you can put to use right awa-
- ePub + Mobi 186 pkt
(194,65 zł najniższa cena z 30 dni)
186.15 zł
219.00 zł (-15%) -
-
Promocja Promocja 2za1
Dzięki tej książce błyskawicznie uzyskasz odpowiedzi na nurtujące programistów pytania o walidację danych w formularzach, testowanie kodu czy powiązanie kodu aplikacji z kodem serwerowym. Dowiesz się również, jak zapewnić sobie możliwość wielokrotnego wykorzystywania kodu i implementacji złożonych operacji w prosty sposób. Znajdziesz tu szereg przykładowych kodów, pogrupowanych tematycznie i dobranych tak, aby ułatwić Ci rozwiązywanie problemów najczęściej pojawiających się podczas pisania aplikacji Reacta. Poszczególne próbki kodu zostały gruntownie objaśnione, dzięki czemu szybko zrozumiesz, w jaki sposób współdziałają komponenty aplikacji Reacta i jego biblioteki. A wtedy w pełni docenisz zalety tego frameworku!- PDF + ePub + Mobi
- Druk 49 pkt
(49,50 zł najniższa cena z 30 dni)
49.50 zł
99.00 zł (-50%) -
Promocja Promocja 2za1
What will you learn from this book?If you have an idea for a killer Android app, this fully revised and updated edition will get you up and running in a jiffy. You'll go beyond syntax and how-to manuals and learn how to think like a great Android developer. This hands-on book teaches you everything from designing user interfaces to building multi-s-
- ePub + Mobi 254 pkt
(254,15 zł najniższa cena z 30 dni)
254.15 zł
299.00 zł (-15%) -
-
Promocja Promocja 2za1
React helps you create and work on an app in just a few minutes. But learning how to put all the pieces together is hard. How do you validate a form? Or implement a complex multistep user action without writing messy code? How do you test your code? Make it reusable? Wire it to a backend? Keep it easy to understand? The React Cookbook delivers answ-
- ePub + Mobi 169 pkt
(169,14 zł najniższa cena z 30 dni)
169.14 zł
199.00 zł (-15%) -
-
Promocja Promocja 2za1
Ta książka, podobnie jak inne pozycje z serii Rusz głową!, została przygotowana zgodnie z jedyną w swoim rodzaju metodyką nauczania wykorzystującą zasady funkcjonowania ludzkiego mózgu. Dzięki niej nauczysz się myśleć jak najlepsi programiści i niepostrzeżenie zaczniesz tworzyć wydajny kod w Kotlinie.- Druk 44 pkt
(44,50 zł najniższa cena z 30 dni)
44.50 zł
89.00 zł (-50%) -
Promocja Promocja 2za1
What will you learn from this book?Head First Kotlin is a complete introduction to coding in Kotlin. This hands-on book helps you learn the Kotlin language with a unique method that goes beyond syntax and how-to manuals and teaches you how to think like a great Kotlin developer. You’ll learn everything from language fundamentals to collections, gen-
- ePub + Mobi 194 pkt
(203,15 zł najniższa cena z 30 dni)
194.65 zł
228.99 zł (-15%) -
-
Promocja Promocja 2za1
Sięgnij po ten nietypowy podręcznik! Możesz uznać jego formę i sposób przekazywania treści za dziwny, ale prędko przekonasz się, że jest wyjątkowo skuteczny. Twój mózg się zaangażuje i błyskawicznie przyswoi sobie techniki programowania dla Androida. A to wszystko dzięki nowatorskiemu podejściu autorów, którzy uznali, że najszybciej uczymy się wtedy, gdy uwzględnimy specyfikę działania własnego mózgu! Dowiesz się, jak przygotować sobie warsztat pracy, czyli Android Studio. Od razu zaprojektujesz strukturę aplikacji i zbudujesz dobry interfejs. Będziesz swobodnie posługiwał się aktywnościami, intencjami, usługami. Poznasz narzędzia Gradle, ART i ADB, dowiesz się, jak wykorzystywać bazy danych SQLite. A potem będzie jeszcze ciekawiej...- Druk 59 pkt
(59,50 zł najniższa cena z 30 dni)
59.50 zł
119.00 zł (-50%) -
Promocja Promocja 2za1
Książka, którą trzymasz w rękach, to podręcznik niezwykły, gdyż uwzględnia specyfikę funkcjonowania ludzkiego mózgu i sposób, w jaki najszybciej się uczy. Dzięki nowatorskiemu podejściu autorów nauka pisania aplikacji nie jest nudna: niepostrzeżenie będziesz nabierał coraz większej wprawy. Już w trakcie zapoznawania się z podstawowymi koncepcjami rozpoczniesz pracę w IDE Android Studio. Dowiesz się, jak zaprojektować strukturę aplikacji i jak zbudować idealny interfejs.- Druk 49 pkt
(49,50 zł najniższa cena z 30 dni)
49.50 zł
99.00 zł (-50%) -
Promocja Promocja 2za1
Dzięki tej książce możesz dołączyć do ich grona! Kolejne wydanie z serii „Rusz głową” to gwarancja sukcesu. Zastosowanie nowatorskich technik nauki pozwala na błyskawiczne przyswojenie wiedzy. W trakcie lektury poznasz składnię języka C, dostępne typy zmiennych, sposoby zarządzania pamięcią oraz zasady tworzenia przejrzystego kodu. Ponadto nauczysz się biegle obsługiwać kompilator, korzystać z plików nagłówkowych oraz przesyłać komunikaty między procesami. Dzięki licznym ćwiczeniom bez problemu utrwalisz zdobytą wiedzę. Książka ta jest wprost genialną pozycją dla wszystkich osób chcących wkroczyć w świat języka C. Przyda się również studentom na zajęciach z programowania. Warto ją mieć!- Druk 49 pkt
(49,50 zł najniższa cena z 30 dni)
49.50 zł
99.00 zł (-50%)
Kup polskie wydanie:
Ebooka "Head First Statistics. A Brain-Friendly Guide" przeczytasz na:
-
czytnikach Inkbook, Kindle, Pocketbook, Onyx Boox i innych
-
systemach Windows, MacOS i innych
-
systemach Windows, Android, iOS, HarmonyOS
-
na dowolnych urządzeniach i aplikacjach obsługujących formaty: PDF, EPub, Mobi
Masz pytania? Zajrzyj do zakładki Pomoc »
Szczegóły książki
- ISBN Ebooka:
- 978-14-493-3156-6, 9781449331566
- Data wydania ebooka :
-
2008-08-26
Data wydania ebooka często jest dniem wprowadzenia tytułu do sprzedaży i może nie być równoznaczna z datą wydania książki papierowej. Dodatkowe informacje możesz znaleźć w darmowym fragmencie. Jeśli masz wątpliwości skontaktuj się z nami sklep@ebookpoint.pl.
- Język publikacji:
- angielski
- Rozmiar pliku ePub:
- 24.6MB
- Rozmiar pliku Mobi:
- 42.3MB
Dostępność produktu
Produkt nie został jeszcze oceniony pod kątem ułatwień dostępu lub nie podano żadnych informacji o ułatwieniach dostępu lub są one niewystarczające. Prawdopodobnie Wydawca/Dostawca jeszcze nie umożliwił dokonania walidacji produktu lub nie przekazał odpowiednich informacji na temat jego dostępności.
Spis treści książki
- Head First Statistics
- Dedication
- A Note Regarding Supplemental Files
- Advance Praise for Head First Statistics
- Praise for other Head First books
- Author of Head First Statistics
- How to use this Book: Intro
- Who is this book for?
- Who should probably back away from this book?
- We know what youre thinking
- We know what your brain is thinking
- Metacognition: thinking about thinking
- Heres what WE did
- Heres what YOU can do to bend your brain into submission
- Read Me
- The technical review team
- Acknowledgments
- Safari Books Online
- Who is this book for?
- 1. Visualizing Information: First Impressions
- Statistics are everywhere
- But why learn statistics?
- A tale of two charts
- Manic Mango needs some charts
- The humble pie chart
- So when are pie charts useful?
- Chart failure
- Bar charts can allow for more accuracy
- Vertical bar charts
- Horizontal bar charts
- Its a matter of scale
- Using percentage scales
- Using frequency scales
- Dealing with multiple sets of data
- The split-category bar chart
- The segmented bar chart
- Your bar charts rock
- Categories vs. numbers
- Categorical or qualitative data
- Numerical or quantitative data
- Dealing with grouped data
- To make a histogram, start by finding bar widths
- Manic Mango needs another chart
- A histograms bar area must be proportional to frequency
- Make the area of histogram bars proportional to frequency
- Step 1: Find the bar widths
- Step 2: Find the bar heights
- Step 3: Draw your charta histogram
- Histograms cant do everything
- Introducing cumulative frequency
- So what are the cumulative frequencies?
- Drawing the cumulative frequency graph
- Choosing the right chart
- Manic Mango conquered the games market!
- 2. Measuring Central Tendency: The Middle Way
- Welcome to the Health Club
- A common measure of average is the mean
- Mean math
- Letters and numbers
- Dealing with unknowns
- Back to the mean
- The mean has its own symbol
- Handling frequencies
- Back to the Health Club
- Everybody was Kung Fu fighting
- Our data has outliers
- The butler outliers did it
- Watercooler conversation
- Finding the median
- Business is booming
- The Little Ducklings swimming class
- Frequency Magnets
- Frequency Magnets
- What went wrong with the mean and median?
- Introducing the mode
- It even works with categorical data
- Congratulations!
- 3. Measuring Variability and Spread: Power Ranges
- Wanted: one player
- We need to compare player scores
- Use the range to differentiate between data sets
- Measuring the range
- The problem with outliers
- We need to get away from outliers
- Quartiles come to the rescue
- The interquartile range excludes outliers
- Quartile anatomy
- Finding the position of the lower quartile
- Finding the position of the upper quartile
- Were not just limited to quartiles
- So what are percentiles?
- Percentile uses
- Finding percentiles
- Box and whisker plots let you visualize ranges
- Variability is more than just spread
- Calculating average distances
- We can calculate variation with the variance...
- ...but standard deviation is a more intuitive measure
- Standard deviation know-how
- A quicker calculation for variance
- What if we need a baseline for comparison?
- Use standard scores to compare values across data sets
- Calculating standard scores
- Interpreting standard scores
- So what does this tell us about the players?
- Statsville All Stars win the league!
- 4. Calculating Probabilities: Taking Chances
- Fat Dans Grand Slam
- Roll up for roulette!
- Your very own roulette board
- Place your bets now!
- What are the chances?
- Find roulette probabilities
- You can visualize probabilities with a Venn diagram
- Complementary events
- Its time to play!
- And the winning number is...
- Lets bet on an even more likely event
- You can also add probabilities
- You win!
- Time for another bet
- Exclusive events and intersecting events
- Problems at the intersection
- Some more notation
- Another unlucky spin...
- ...but its time for another bet
- Conditions apply
- Find conditional probabilities
- You can visualize conditional probabilities with a probability tree
- Trees also help you calculate conditional probabilities
- Bad luck!
- We can find P(Black l Even) using the probabilities we already have
- Step 1: Finding P(Black Even)
- So where does this get us?
- Step 2: Finding P(Even)
- Step 3: Finding P(Black l Even)
- These results can be generalized to other problems
- Use the Law of Total Probability to find P(B)
- Introducing Bayes Theorem
- We have a winner!
- Its time for one last bet
- If events affect each other, they are dependent
- If events do not affect each other, they are independent
- More on calculating probability for independent events
- Winner! Winner!
- 5. Using Discrete Probability Distributions: Manage Your Expectations
- Back at Fat Dans Casino
- We can compose a probability distribution for the slot machine
- Expectation gives you a prediction of the results...
- ... and variance tells you about the spread of the results
- Variances and probability distributions
- So how do we calculate E(X )2?
- Lets calculate the slot machines variance
- Fat Dan changed his prices
- Theres a linear relationship between E(X) and E(Y)
- Slot machine transformations
- General formulas for linear transforms
- Every pull of the lever is an independent observation
- Observation shortcuts
- Expectation
- Variance
- New slot machine on the block
- Add E(X) and E(Y) to get E(X + Y)...
- ... and subtract E(X) and E(Y) to get E(X Y)
- You can also add and subtract linear transformations
- Adding aX and bY
- Subtracting aX and bY
- Jackpot!
- 6. Permutations and Combinations: Making Arrangements
- The Statsville Derby
- Its a three-horse race
- How many ways can they cross the finish line?
- Calculate the number of arrangements
- So what if there are n horses?
- Going round in circles
- Its time for the novelty race
- Arranging by individuals is different than arranging by type
- We need to arrange animals by type
- Generalize a formula for arranging duplicates
- Its time for the twenty-horse race
- How many ways can we fill the top three positions?
- Examining permutations
- What if horse order doesnt matter
- Examining combinations
- Its the end of the race
- 7. Geometric, Binomial, and Poisson Distributions: Keeping Things Discrete
- Meet Chad, the hapless snowboarder
- We need to find Chads probability distribution
- Theres a pattern to this probability distribution
- The probability distribution can be represented algebraically
- The pattern of expectations for the geometric distribution
- Expectation is 1/p
- Finding the variance for our distribution
- Youve mastered the geometric distribution
- Should you play, or walk away?
- Generalizing the probability for three questions
- Whats the missing number?
- Lets generalize the probability further
- Whats the expectation and variance?
- Lets look at one trial
- Binomial expectation and variance
- The Statsville Cinema has a problem
- Its a different sort of distribution
- So how do we find probabilities?
- Expectation and variance for the Poisson distribution
- What does the Poisson distribution look like?
- So whats the probability distribution?
- Combine Poisson variables
- The Poisson in disguise
- Anyone for popcorn?
- 8. Using the Normal Distribution: Being Normal
- Discrete data takes exact values...
- ... but not all numeric data is discrete
- Whats the delay?
- We need a probability distribution for continuous data
- Probability density functions can be used for continuous data
- Probability = area
- To calculate probability, start by finding f(x)...
- ... then find probability by finding the area
- Weve found the probability
- Searching for a soul sole mate
- Male modelling
- The normal distribution is an ideal model for continuous data
- So how do we find normal probabilities?
- Three steps to calculating normal probabilities
- Step 1: Determine your distribution
- Step 2: Standardize to N(0, 1)
- To standardize, first move the mean...
- ... then squash the width
- Now find Z for the specific value you want to find probability for
- Step 3: Look up the probability in your handy table
- So how do you use probability tables?
- Julies probability is in the table
- And they all lived happily ever after
- But it doesnt stop there.
- 9. Using the Normal Distribution ii: Beyond Normal
- Love is a roller coaster
- All aboard the Love Train
- Normal bride + normal groom
- Its still just weight
- Hows the combined weight distributed?
- Finding probabilities
- More people want the Love Train
- Linear transforms describe underlying changes in values...
- So whats the distribution of a linear transform?
- ...and independent observations describe how many values you have
- Expectation and variance for independent observations
- Should we play, or walk away?
- Normal distribution to the rescue
- When to approximate the binomial distribution with the normal
- Finding the mean and variance
- Revisiting the normal approximation
- The binomial is discrete, but the normal is continuous
- Apply a continuity correction before calculating the approximation
- All aboard the Love Train
- When to approximate the binomial distribution with the normal
- When is small...
- When is large...
- So how large is large enough?
- A runaway success!
- 10. Using Statistical Sampling: Taking Samples
- The Mighty Gumball taste test
- Theyre running out of gumballs
- Test a gumball sample, not the whole gumball population
- Gumball populations
- Gumball samples
- How sampling works
- When sampling goes wrong
- How to design a sample
- Define your target population
- Define your sampling units
- Define your sampling frame
- Sometimes samples can be biased
- Unbiased Samples
- Biased Samples
- Sources of bias
- How to choose your sample
- Simple random sampling
- Sampling with replacement
- Sampling without replacement
- How to choose a simple random sample
- Drawing lots
- Random number generators
- There are other types of sampling
- We can use stratified sampling...
- ...or we can use cluster sampling...
- ...or even systematic sampling
- Mighty Gumball has a sample
- So whats next?
- 11. Estimating Populations and Samples: Making Predictions
- So how long does flavor really last for?
- Lets start by estimating the population mean
- Point estimators can approximate population parameters
- Lets estimate the population variance
- We need a different point estimator than sample variance
- So what is the estimator?
- Which formulas which?
- Mighty Gumball has done more sampling
- Its a question of proportion
- Predicting population proportion
- Buy your gumballs here!
- Introducing new jumbo boxes
- So how does this relate to sampling?
- The sampling distribution of proportions
- So whats the expectation of Ps?
- And whats the variance of Ps?
- Find the distribution of Ps
- Ps follows a normal distribution
- Pscontinuity correction required
- How many gumballs?
- Theres just one more problem...
- We need probabilities for the sample mean
- The sampling distribution of the mean
- Find the expectation for X
- What about the the variance of X?
- So how is X distributed?
- If n is large, X can still be approximated by the normal distribution
- Introducing the Central Limit Theorem
- Using the central limit theorem
- The binomial distribution
- The Poisson distribution
- Finding probabilities
- Sampling saves the day!
- Youve made a lot of progress
- 12. Constructing Confidence Intervals: Guessing with Confidence
- Mighty Gumball is in trouble
- They need you to save them
- The problem with precision
- Introducing confidence intervals
- Four steps for finding confidence intervals
- Step 1: Choose your population statistic
- Step 2: Find its sampling distribution
- Point estimators to the rescue
- Weve found the distribution for X
- Step 3: Decide on the level of confidence
- How to select an appropriate confidence level
- Step 4: Find the confidence limits
- Start by finding Z
- Rewrite the inequality in terms of
- Finally, find the value of X
- Youve found the confidence interval
- Lets summarize the steps
- Handy shortcuts for confidence intervals
- Whats the interval in general?
- Just one more problem...
- Step 1: Choose your population statistic
- Step 2: Find its sampling distribution
- X follows the t-distribution when the sample is small
- Find the standard score for the t-distribution
- Step 3: Decide on the level of confidence
- Step 4: Find the confidence limits
- Using t-distribution probability tables
- The t-distribution vs. the normal distribution
- Youve found the confidence intervals!
- Mighty Gumball is in trouble
- 13. Using Hypothesis Tests: Look At The Evidence
- Statsvilles new miracle drug
- So whats the problem?
- Resolving the conflict from 50,000 feet
- The six steps for hypothesis testing
- Step 1: Decide on the hypothesis
- The drug companys claim
- So whats the null hypothesis for SnoreCull?
- So whats the alternative?
- The doctors perspective
- The alternate hypothesis for SnoreCull
- Step 2: Choose your test statistic
- Whats the test statistic for SnoreCull?
- Step 3: Determine the critical region
- At what point can we reject the drug company claims?
- To find the critical region, first decide on the significance level
- So what significance level should we use?
- Step 4: Find the p-value
- How do we find the p-value?
- Weve found the p-value
- Step 5: Is the sample result in the critical region?
- Step 6: Make your decision
- So what did we just do?
- What if the sample size is larger?
- Lets conduct another hypothesis test
- Step 1: Decide on the hypotheses
- Its still the same problem
- Step 2: Choose the test statistic
- Use the normal to approximate the binomial in our test statistic
- Step 3: Find the critical region
- SnoreCull failed the test
- Mistakes can happen
- Lets start with Type I errors
- So whats the probability of getting a Type I error?
- What about Type II errors?
- So how do we find ?
- Finding errors for SnoreCull
- Lets start with the Type I error
- So what about the Type II error?
- We need to find the range of values
- Find P(Type II error)
- Introducing power
- So whats the power of SnoreCull?
- The doctors happy
- But it doesnt stop there
- 14. The 2 Distribution: Theres Something Going On...
- There may be trouble ahead at Fat Dans Casino
- Lets start with the slot machines
- The 2 test assesses difference
- So what does the test statistic represent?
- Two main uses of the 2 distribution
- When v is 1 or 2
- When v is greater than 2
- v represents degrees of freedom
- So whats v?
- Whats the significance?
- How to use 2 probability tables
- Hypothesis testing with 2
- Youve solved the slot machine mystery
- Fat Dan has another problem
- the 2 distribution can test for independence
- You can find the expected frequencies using probability
- So what are the frequencies?
- How do we find the frequencies in general?
- We still need to calculate degrees of freedom
- Generalizing the degrees of freedom
- And the formula is...
- Youve saved the casino
- 15. Correlation and Regression: Whats My Line?
- Never trust the weather
- Lets analyze sunshine and attendance
- Exploring types of data
- All about bivariate data
- Visualizing bivariate data
- Scatter diagrams show you patterns
- Correlation vs. causation
- We need to predict the concert attendance
- Predict values with a line of best fit
- Your best guess is still a guess
- We need to find the equation of the line
- We need to minimize the errors
- Introducing the sum of squared errors
- Find the equation for the line of best fit
- Lets start with b
- Finding the slope for the line of best fit
- We use x and to help us find b
- Finding the slope for the line of best fit, part ii
- Weve found b, but what about a?
- Youve made the connection
- Lets look at some correlations
- Accurate linear correlation
- No linear correlation
- The correlation coefficient measures how well the line fits the data
- Theres a formula for calculating the correlation coefficient, r
- Find r for the concert data
- Find r for the concert data, continued
- Youve saved the day!
- Leaving town...
- Its been great having you here in Statsville!
- A. Leftovers: The Top Ten Things (we didnt cover)
- #1. Other ways of presenting data
- Dotplots
- Stemplots
- #2. Distribution anatomy
- The empirical rule for normal distributions
- Chebyshevs rule for any distribution
- #3. Experiments
- So what makes for a good experiment?
- Designing your experiment
- Completely randomized design
- Randomized block design
- Matched pairs design
- #4. Least square regression alternate notation
- #5. The coefficient of determination
- Calculating r2
- #6. Non-linear relationships
- #7. The confidence interval for the slope of a regression line
- The margin of error for b
- #8. Sampling distributions the difference between two means
- #9. Sampling distributions the difference between two proportions
- #10. E(X) and Var(X) for continuous probability distributions
- Finding E(X)
- Finding Var(X)
- #1. Other ways of presenting data
- B. Statistics Tables: Looking Things Up
- #1. Standard normal probabilities
- #2. t-distribution critical values
- #3. X2 critical values
- Index
- About the Author
- Copyright
O'Reilly Media - inne książki
-
Nowość Promocja Promocja 2za1
Java Generics and Collections has been the go-to guide to generics for more than a decade. This second edition covers Java 21, providing a clear guide to generics from their most common uses to the strangest corner cases, giving you everything you need to know to use and write generic APIs effectively. It covers the collections library thoroughly,-
- ePub + Mobi 186 pkt
(186,15 zł najniższa cena z 30 dni)
186.15 zł
219.00 zł (-15%) -
-
Nowość Promocja Promocja 2za1
Learn how to manage Kubernetes clusters and application configurations with Argo CD, the easy-to-use open source GitOps engine. With this practical book, development teams will quickly gain a foundational understanding of Argo CD for deploying and managing containerized applications - without having to be a Kubernetes expert, and without needing fu-
- ePub + Mobi 186 pkt
(186,15 zł najniższa cena z 30 dni)
186.15 zł
219.00 zł (-15%) -
-
Nowość Promocja Promocja 2za1
With AI in the hands of cybercriminals, traditional security controls and response mechanisms are swiftly moving toward obsolescence. Intelligent Continuous Security (ICS) helps organizations stay toe-to-toe with adversaries, replacing outmoded defenses with a cohesive strategy that unifies security across the entire software lifecycle. Author Marc-
- ePub + Mobi 220 pkt
(220,15 zł najniższa cena z 30 dni)
220.15 zł
259.00 zł (-15%) -
-
Nowość Promocja Promocja 2za1
Want to build big data solutions in Google Cloud? Dataproc Cookbook is your hands-on guide to mastering Dataproc and the essential GCP fundamentals—like networking, security, monitoring, and cost optimization--that apply across Google Cloud services. Learn practical skills that not only fast-track your Dataproc expertise, but also help you succeed-
- ePub + Mobi 220 pkt
(220,15 zł najniższa cena z 30 dni)
220.15 zł
259.00 zł (-15%) -
-
Nowość Promocja Promocja 2za1
Despite recent advances in technology, software developers, enterprise users, and business technologists still spend much of their time performing repetitive manual tasks. This cookbook shows you how to level up your automation skills with Power Automate to drive efficiency and productivity within your organization.Author Ahmad Najjar provides reci-
- ePub + Mobi 228 pkt
(228,65 zł najniższa cena z 30 dni)
228.65 zł
269.00 zł (-15%) -
-
Nowość Promocja Promocja 2za1
With the Ansible automation tool, developers and system administrators in the enterprise can automate the provisioning, configuration, and management of distributed and on-premises systems. This study guide prepares you for the Red Hat Certified Engineer (RHCE) certification exam, 90% of which covers Ansible. Red Hat's Alex Soto Bueno and And-
- ePub + Mobi 169 pkt
(169,14 zł najniższa cena z 30 dni)
169.14 zł
199.00 zł (-15%) -
-
Nowość Promocja Promocja 2za1
This book is a guide to DevOps and software delivery: that is, a guide to the numerous tools and techniques that are required to take that application code and run it and maintain it in production, where it can generate value for your users and your company on an ongoing basis. This includes going through all the modern practices for deploying appl-
- ePub + Mobi 194 pkt
(203,15 zł najniższa cena z 30 dni)
194.65 zł
228.99 zł (-15%) -
-
Promocja Promocja 2za1
Organizations are increasingly vulnerable as attack surfaces grow and cyber threats evolve. Addressing these threats is vital, making attack surface management (ASM) essential for security leaders globally. This practical book provides a comprehensive guide to help you master ASM. Cybersecurity engineers, system administrators, and network administ-
- ePub + Mobi 169 pkt
(169,14 zł najniższa cena z 30 dni)
169.14 zł
199.00 zł (-15%) -
-
Promocja Promocja 2za1
In today's data-driven world, earning the Tableau Certified Data Analyst credential signals your ability to connect, analyze, and communicate insights using one of the industry's leading visualization platforms. This study guide offers practical and comprehensive preparation for the certification exam, with walk-throughs, best practices, vocabulary-
- ePub + Mobi 169 pkt
(169,14 zł najniższa cena z 30 dni)
169.14 zł
199.00 zł (-15%) -
-
Promocja Promocja 2za1
This concise yet comprehensive guide shows developers and architects how to tackle data integration challenges with MuleSoft. Authors Pooja Kamath and Diane Kesler take you through the process necessary to build robust and scalable integration solutions step-by-step.Supported by real-world use cases, Building Integrations with MuleSoft teaches you-
- ePub + Mobi 169 pkt
(169,14 zł najniższa cena z 30 dni)
169.14 zł
199.00 zł (-15%) -
Dzięki opcji "Druk na żądanie" do sprzedaży wracają tytuły Grupy Helion, które cieszyły sie dużym zainteresowaniem, a których nakład został wyprzedany.
Dla naszych Czytelników wydrukowaliśmy dodatkową pulę egzemplarzy w technice druku cyfrowego.
Co powinieneś wiedzieć o usłudze "Druk na żądanie":
- usługa obejmuje tylko widoczną poniżej listę tytułów, którą na bieżąco aktualizujemy;
- cena książki może być wyższa od początkowej ceny detalicznej, co jest spowodowane kosztami druku cyfrowego (wyższymi niż koszty tradycyjnego druku offsetowego). Obowiązująca cena jest zawsze podawana na stronie WWW książki;
- zawartość książki wraz z dodatkami (płyta CD, DVD) odpowiada jej pierwotnemu wydaniu i jest w pełni komplementarna;
- usługa nie obejmuje książek w kolorze.
Masz pytanie o konkretny tytuł? Napisz do nas: sklep@ebookpoint.pl
Książka drukowana


Oceny i opinie klientów: Head First Statistics. A Brain-Friendly Guide Dawn Griffiths
(0)