

- Autor:
- Dawn Griffiths
- Ocena:
- Bądź pierwszym, który oceni tę książkę
- Stron:
- 592
- Dostępne formaty:
-
ePubMobi
Opis
książki
:
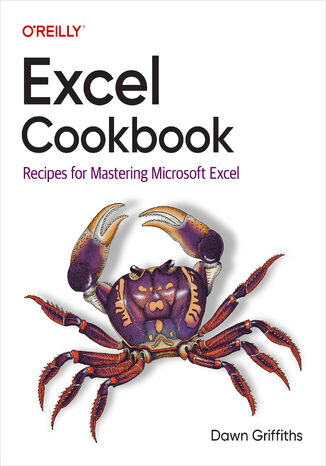
Excel Cookbook
Filled with tips, tricks, and techniques, this easy-to-use book is the perfect resource for intermediate to advanced users of Excel. You'll find complete recipes for more than a dozen topics covering formulas, PivotTables, charts, Power Query, and more. Each recipe poses a particular problem and outlines a solution that you can put to use right away—without having to comb through tutorial pages.
Whether you're a data analyst, project manager, or financial analyst, author Dawn Griffiths directs you straight to the answers you need. Ideal as a quick reference, Excel Cookbook is also perfect for learning how to work in a more efficient way, leading to greater productivity on the job. With this book, you'll jump in and get answers to your questions—fast.
This cookbook shows you how to:
- Get the most out of Excel's features
- Address complex data problems in the best way possible
- Collect, manage, and analyze data from a variety of sources
- Use functions and formulas with ease—including dynamic array and lambda formulas
- Analyze data with PivotTables, Power Pivot, and more
- Import and transform data with Power Query
- Write custom functions and automate Excel with VBA
Wybrane bestsellery
-
Promocja
 W ciągu ostatnich kilku lat arkusz kalkulacyjny Excel intensywnie się rozwijał. Pojawiły się nowe funkcje i wbudowane narzędzia, pozwalające rozwiązywać typowe problemy w sposób bardziej zwięzły i efektywny. Zaszła między innymi rewolucyjna zmiana w podejściu do tablic i wykonywanych z ich udziałem obliczeń. Wyjściowo Excel był „komórkocentryczny” - główny nacisk kładziono w nim na użycie do obliczeń pojedynczych komórek traktowanych odrębnie i tworzenie na ich podstawie ciągów obliczeniowych. Aktualnie akcentuje się przede wszystkim przetwarzanie od razu całych tablic danych, obejmujących wiele komórek.
-
ebook
-
książka
48 pkt
(44,50 zł najniższa cena z 30 dni)
48.95 zł
89.00 zł (-45%) -
-
Promocja
 Teraz możesz łatwo sprostać takim wyzwaniom i uzyskiwać niezwykłe rezultaty. Wystarczy, że skorzystasz z narzędzi dostępnych w Excelu ― i z tej książki. To zaktualizowane wydanie praktycznego przewodnika po Power Query. Pozwoli Ci opanować umiejętność efektywnego przetwarzania danych i wydobywania z nich wartościowych informacji. Dowiesz się, jak wykonywać złożone prace analityczne i jak używać procedur w języku M. Znajdziesz tu ponad 70 ćwiczeń i 200 plików, dzięki którym nauczysz się importować bezładne, rozdzielone tabele danych i automatycznie przekształcać je w ustrukturyzowane zbiory gotowe do analizy. Większość opisanych technik z łatwością zapamiętasz i użyjesz do swoich potrzeb.
-
ebook
-
książka
59 pkt
(54,50 zł najniższa cena z 30 dni)
59.94 zł
109.00 zł (-45%) -
-
Promocja
 Analityka danych to umiejętność biznesowa, której fundamentem jest Excel. Dzięki biegłej znajomości tego narzędzia nie tylko usprawnisz raportowanie i automatyzację monotonnych zadań, ale także swobodnie przejdziesz do nauki bardziej zaawansowanych narzędzi analitycznych, takich jak Power BI czy SQL. Wiele osób korzysta z Excela na co dzień, ale nie zdaje sobie sprawy, jaki potencjał w nim drzemie. To nie jest tylko arkusz kalkulacyjny – to potężny mechanizm, który pozwala na tworzenie dynamicznych dashboardów, ułatwiających analizę kluczowych wskaźników sprzedażowych, finansowych i kadrowych. Tworzenie takich dashboardów nie wymaga skomplikowanej wiedzy programistycznej, a efekty, jakie osiągniesz, mogą być naprawdę imponujące. Z naszym szkoleniem odkryjesz ukryte funkcje Excela – od tabel przestawnych, przez fragmentatory, po dynamiczne wykresy i inteligentne formuły, za sprawą których będziesz wizualizować dane w sposób czytelny i atrakcyjny. Automatyzacja procesów za pomocą Excela pozwoli Ci zaoszczędzić godziny pracy, wyeliminuje bowiem powtarzalne zadania i poprawi organizację danych. Bez względu na to, czy pracujesz w księgowości, dziale HR, czy zajmujesz się zarządzaniem projektami, umiejętność przejrzystego prezentowania danych znacząco wpłynie na Twoje decyzje biznesowe. Pracodawcy poszukują specjalistów, którzy potrafią analizować liczby i prezentować je w czytelnej formie. Wyróżnij się na rynku i zdobądź wymarzony awans! Twórz dashboardy jak prawdziwy profesjonalista, zamieniając surowe dane w przejrzyste i dynamiczne wizualizacje.
-
kurs
96 pkt
(64,50 zł najniższa cena z 30 dni)
96.75 zł
129.00 zł (-25%) -
-
Promocja
 Przeciętny użytkownik Excela może jednak nie wiedzieć, że program oferuje mnóstwo zaawansowanych funkcji pozwalających wydajnie oszczędzać czas dzięki automatyzacji i przyspieszaniu powtarzalnych zadań. Te zaawansowane funkcje są dostępne dla każdego, niezależnie od branży. Wystarczy opanować kilka prostych trików, które poznasz za sprawą naszego kursu – o ile zdecydujesz się wziąć w nim udział. W jego trakcie przyjrzymy się nie tylko tabelom przestawnym czy warunkowemu formatowaniu. Sięgniemy także po potężne narzędzia, które wspierają wysoce zaawansowaną analizę danych. Jeśli zastanawiasz się, czy to wiedza dla Ciebie, spójrz na sprawę z punktu widzenia rynku – znajomość zaawansowanych funkcji Excela jest jedną z najczęściej wymienianych umiejętności w ofertach pracy, zwłaszcza w obszarze analityki i zarządzania danymi.
-
kurs
74 pkt
(49,50 zł najniższa cena z 30 dni)
74.24 zł
99.00 zł (-25%) -
-
Promocja
 Dzięki tej praktycznej książce przekonasz się, że w Excelu możesz przeprowadzić dogłębną analizę danych i wyciągnąć z nich cenną wiedzę. Wystarczy, że skorzystasz z najnowszych funkcji i narzędzi Excela. W poradniku pokazano, jak za pomocą Power Query budować przepływy pracy porządkujące dane i jak projektować w skoroszycie relacyjne modele danych przy użyciu Power Pivot. Ponadto odkryjesz nowe możliwości przeprowadzania analiz, w tym dynamiczne funkcje tablicowe i pozyskiwanie wartościowych informacji z wykorzystaniem sztucznej inteligencji. Dowiesz się również, jak za sprawą integracji z Pythonem zautomatyzować analizę danych i budować raporty.
-
ebook
-
książka
36 pkt
(33,50 zł najniższa cena z 30 dni)
36.84 zł
67.00 zł (-45%) -
-
Promocja
 Język DAX (Data Analysis Expressions) został stworzony przez firmę Microsoft jako język wyrażeń, służący do pracy z takimi narzędziami analizy danych jak Power BI, Power Pivot w Excelu czy SQL Server Analysis Services. Pozwala tworzyć zaawansowane raporty, analizy biznesowe i dynamiczne wizualizacje danych. Jeśli zamierzasz na poważnie zająć się analizą danych, warto nauczyć się korzystać z języka DAX. Ten kurs pokaże Ci, jakie możliwości oferuje on w tandemie z Power BI – zestawem aplikacji i usług klasy business intelligence od Microsoft, służącym gromadzeniu, zarządzaniu, przetwarzaniu i analizie danych pochodzących z różnych źródeł. Power BI uznaje się aktualnie za najpopularniejsze narzędzie w obszarze business intelligence na rynku.
-
kurs
171 pkt
(114,50 zł najniższa cena z 30 dni)
171.74 zł
229.00 zł (-25%) -
-
Promocja
 Język DAX (ang. Data Analysis Expressions) został stworzony przez firmę Microsoft, by umożliwić wykonywanie efektywnych obliczeń na danych przechowywanych w wielu tabelach i przetwarzanych w Power BI, Excel Power Pivot czy SQL Server Analysis Services. Możliwości DAX-a są naprawdę ogromne, osoba, która go opanuje, zyska potężnego sprzymierzeńca w pracy z wielkimi zbiorami danych ukrytymi pod wyświetlanymi w raportach wykresami czy tabelami.
-
ebook
-
książka
21 pkt
(19,95 zł najniższa cena z 30 dni)
21.95 zł
39.90 zł (-45%) -
-
Promocja
 Na egzaminie maturalnym z informatyki każdego roku trafia się jedno zadanie analityczne, do którego rozwiązania przydaje się znajomość arkusza kalkulacyjnego. Za takie zadanie można uzyskać aż do 20 procent wszystkich punktów! Jak się do niego przygotować? Na przykład z naszym kursem. Wspólnie przeanalizujemy 10 zadań maturalnych z wszystkich arkuszy i informatorów dostępnych w formule matury obowiązującej od 2023 roku. Każde wymaga użycia (nieraz wielokrotnego) tabel przestawnych. We wszystkich pojawiają się te same funkcje, podobne schematy. Także pewne formuły, które będziemy w ramach kursu wspólnie konstruować, bywają bardzo podobne. I nic w tym dziwnego – zadania maturalne sprawdzają przecież te same czy podobne umiejętności: umiejętność analitycznego myślenia i umiejętność przetwarzania danych z użyciem odpowiednich narzędzi komputerowych. Wystarczy więc dostrzegać pewne szablony, a także znać odpowiednie narzędzia i metody. Każdy maturzysta przystępujący do egzaminu z informatyki chciałby podejść do zadania z gotowym sposobem, prawda? Dlatego ten kurs będzie dla Ciebie idealnym wyborem.
-
kurs
96 pkt
(64,50 zł najniższa cena z 30 dni)
96.75 zł
129.00 zł (-25%) -
-
Promocja
 Stanowiący część Microsoft Power Platform zestaw narzędzi Power BI służy przede wszystkim wizualizacji danych i raportowaniu. Ze względu na intuicyjny interfejs i duże możliwości narzędzia te są coraz częściej zaprzęgane do pracy w firmach na całym świecie, w rozmaitych branżach – od finansów, przez marketing, aż po zarządzanie zasobami ludzkimi. Szkoląc się z naszym kursem, poznasz to rozwiązanie od strony praktycznej i zdobędziesz umiejętności gotowe do zastosowania w Twojej codziennej pracy. W ramach nauki opanujesz nie tylko podstawy Power BI, ale też najbardziej zaawansowane funkcje, które oferuje to oprogramowanie, ponieważ będziemy działać na realnych przykładach, z życia wziętych – takich, na które będziesz natrafiać codziennie w swojej praktyce biznesowej.
-
kurs
149 pkt
(99,49 zł najniższa cena z 30 dni)
149.25 zł
199.00 zł (-25%) -
-
Promocja
 Sztuczna inteligencja przyczyniła się do prawdziwej rewolucji technologicznej i zmieniła branżę informatyczną. Po funkcje oparte na AI chętnie sięgnął Microsoft, by udoskonalić swój wiodący produkt – Excela. AI poprzez zaawansowane algorytmy potrafi automatycznie analizować i interpretować duże zbiory danych, co przyspiesza proces podejmowania decyzji. Zastosowanie mechanizmów AI w Excelu otwiera nowe możliwości w pracy z danymi i analizie tekstowej. W efekcie integracji ChatGPT z MS Excel użytkownicy mogą uzyskać szybkie i skuteczne odpowiedzi na pytania związane z danymi bez konieczności opuszczania arkusza kalkulacyjnego. Dzięki korzystaniu z trików AI i narzędzi do automatyzacji zadań, jak Office Script i Power Query, możesz się pożegnać z traceniem dnia na rutynowe czynności. Postaw na automatyzację zadań z AI – oszczędź swój czas i zminimalizuj ryzyko manualnych błędów w pracy!
-
kurs
186 pkt
(39,90 zł najniższa cena z 30 dni)
186.75 zł
249.00 zł (-25%) -
O autorze książki
Dawn Griffiths jest znakomitą i bardzo doświadczoną programistką oraz autorką wielu książek z serii Rusz głową!. Wraz z mężem Davidem opracowała także animowany kurs wideo The Agile Sketchpad, stanowiący próbę uczenia kluczowych pojęć i technik w sposób zapewniający aktywną pracę mózgu i utrzymanie zaangażowania. Jej pasje to tai chi, bieganie i gotowanie.
Dawn Griffiths - pozostałe książki
-
Promocja
 Ta książka, podobnie jak inne pozycje z serii Rusz głową!, została przygotowana zgodnie z jedyną w swoim rodzaju metodyką nauczania wykorzystującą zasady funkcjonowania ludzkiego mózgu. Dzięki niej nauczysz się myśleć jak najlepsi programiści i niepostrzeżenie zaczniesz tworzyć wydajny kod w Kotlinie.
-
ebook
-
książka
48 pkt
(44,50 zł najniższa cena z 30 dni)
48.95 zł
89.00 zł (-45%) -
-
Promocja
 Dzięki tej książce błyskawicznie uzyskasz odpowiedzi na nurtujące programistów pytania o walidację danych w formularzach, testowanie kodu czy powiązanie kodu aplikacji z kodem serwerowym. Dowiesz się również, jak zapewnić sobie możliwość wielokrotnego wykorzystywania kodu i implementacji złożonych operacji w prosty sposób. Znajdziesz tu szereg przykładowych kodów, pogrupowanych tematycznie i dobranych tak, aby ułatwić Ci rozwiązywanie problemów najczęściej pojawiających się podczas pisania aplikacji Reacta. Poszczególne próbki kodu zostały gruntownie objaśnione, dzięki czemu szybko zrozumiesz, w jaki sposób współdziałają komponenty aplikacji Reacta i jego biblioteki. A wtedy w pełni docenisz zalety tego frameworku!
-
ebook
-
książka
54 pkt
(49,50 zł najniższa cena z 30 dni)
54.45 zł
99.00 zł (-45%) -
-
Promocja
 What will you learn from this book?If you have an idea for a killer Android app, this fully revised and updated edition will get you up and running in a jiffy. You'll go beyond syntax and how-to manuals and learn how to think like a great Android developer. This hands-on book teaches you everything from designing user interfaces to building multi-s
-
-
ebook
254 pkt
(179,40 zł najniższa cena z 30 dni)
254.15 zł
299.00 zł (-15%) -
-
Promocja
 React helps you create and work on an app in just a few minutes. But learning how to put all the pieces together is hard. How do you validate a form? Or implement a complex multistep user action without writing messy code? How do you test your code? Make it reusable? Wire it to a backend? Keep it easy to understand? The React Cookbook delivers answ
-
-
ebook
169 pkt
(119,40 zł najniższa cena z 30 dni)
169.14 zł
199.00 zł (-15%) -
-
Promocja
 What will you learn from this book?Head First Kotlin is a complete introduction to coding in Kotlin. This hands-on book helps you learn the Kotlin language with a unique method that goes beyond syntax and how-to manuals and teaches you how to think like a great Kotlin developer. You’ll learn everything from language fundamentals to collections, gen
-
-
ebook
203 pkt
(143,40 zł najniższa cena z 30 dni)
203.15 zł
239.00 zł (-15%) -
-
Promocja
 Sięgnij po ten nietypowy podręcznik! Możesz uznać jego formę i sposób przekazywania treści za dziwny, ale prędko przekonasz się, że jest wyjątkowo skuteczny. Twój mózg się zaangażuje i błyskawicznie przyswoi sobie techniki programowania dla Androida. A to wszystko dzięki nowatorskiemu podejściu autorów, którzy uznali, że najszybciej uczymy się wtedy, gdy uwzględnimy specyfikę działania własnego mózgu! Dowiesz się, jak przygotować sobie warsztat pracy, czyli Android Studio. Od razu zaprojektujesz strukturę aplikacji i zbudujesz dobry interfejs. Będziesz swobodnie posługiwał się aktywnościami, intencjami, usługami. Poznasz narzędzia Gradle, ART i ADB, dowiesz się, jak wykorzystywać bazy danych SQLite. A potem będzie jeszcze ciekawiej...
-
ebook
-
książka
65 pkt
(59,50 zł najniższa cena z 30 dni)
65.45 zł
119.00 zł (-45%) -
-
Promocja
 Książka, którą trzymasz w rękach, to podręcznik niezwykły, gdyż uwzględnia specyfikę funkcjonowania ludzkiego mózgu i sposób, w jaki najszybciej się uczy. Dzięki nowatorskiemu podejściu autorów nauka pisania aplikacji nie jest nudna: niepostrzeżenie będziesz nabierał coraz większej wprawy. Już w trakcie zapoznawania się z podstawowymi koncepcjami rozpoczniesz pracę w IDE Android Studio. Dowiesz się, jak zaprojektować strukturę aplikacji i jak zbudować idealny interfejs.
-
ebook
-
książka
54 pkt
(49,50 zł najniższa cena z 30 dni)
54.45 zł
99.00 zł (-45%) -
-
Promocja
 Dzięki tej książce możesz dołączyć do ich grona! Kolejne wydanie z serii „Rusz głową” to gwarancja sukcesu. Zastosowanie nowatorskich technik nauki pozwala na błyskawiczne przyswojenie wiedzy. W trakcie lektury poznasz składnię języka C, dostępne typy zmiennych, sposoby zarządzania pamięcią oraz zasady tworzenia przejrzystego kodu. Ponadto nauczysz się biegle obsługiwać kompilator, korzystać z plików nagłówkowych oraz przesyłać komunikaty między procesami. Dzięki licznym ćwiczeniom bez problemu utrwalisz zdobytą wiedzę. Książka ta jest wprost genialną pozycją dla wszystkich osób chcących wkroczyć w świat języka C. Przyda się również studentom na zajęciach z programowania. Warto ją mieć!
-
ebook
-
książka
54 pkt
(49,50 zł najniższa cena z 30 dni)
54.45 zł
99.00 zł (-45%) -
-
Promocja
 Najważniejsze zagadnienia zostały tu zilustrowane za pomocą — nierzadko zabawnych — przykładów z życia codziennego, takich jak analiza statystyk sportowych, wyników gier hazardowych czy testów nowych leków. Dzięki tej książce dowiesz się m.in., jak wybrać optymalny wykres do wizualizacji określonych danych, szybko wskazać wartości reprezentatywne dla danego zbioru danych i za pomocą rachunku prawdopodobieństwa przewidywać skutki powtarzalnych zdarzeń w długich seriach. Z łatwością nie tylko przyswoisz zawartą tu wiedzę, ale i wykorzystasz ją w codziennym życiu!
-
ebook
-
książka
37 pkt
(34,50 zł najniższa cena z 30 dni)
37.95 zł
69.00 zł (-45%) -
-
Promocja
 Ever wished you could learn C from a book? Head First C provides a complete learning experience for C and structured imperative programming. With a unique method that goes beyond syntax and how-to manuals, this guide not only teaches you the language, it helps you understand how to be a great programmer. You'll learn key areas such as language basi
-
-
ebook
143 pkt
(101,40 zł najniższa cena z 30 dni)
143.65 zł
169.00 zł (-15%) -
Ebooka "Excel Cookbook" przeczytasz na:
-
czytnikach Inkbook, Kindle, Pocketbook, Onyx Boox i innych
-
systemach Windows, MacOS i innych
-
systemach Windows, Android, iOS, HarmonyOS
-
na dowolnych urządzeniach i aplikacjach obsługujących formaty: PDF, EPub, Mobi
Masz pytania? Zajrzyj do zakładki Pomoc »
Szczegóły książki
- ISBN Ebooka:
- 978-10-981-4328-2, 9781098143282
- Data wydania ebooka :
-
2024-05-14
 Data wydania ebooka często jest dniem wprowadzenia tytułu do sprzedaży i może nie być równoznaczna
z datą wydania książki papierowej. Dodatkowe informacje możesz znaleźć w darmowym fragmencie.
Jeśli masz wątpliwości skontaktuj się z nami sklep@ebookpoint.pl.
- Język publikacji:
- angielski
- Rozmiar pliku ePub:
- 16.9MB
- Rozmiar pliku Mobi:
- 42.6MB
Dostępność produktu
Produkt nie został jeszcze oceniony pod kątem ułatwień dostępu lub nie podano żadnych informacji o ułatwieniach dostępu lub są one niewystarczające. Prawdopodobnie Wydawca/Dostawca jeszcze nie umożliwił dokonania walidacji produktu lub nie przekazał odpowiednich informacji na temat jego dostępności.
Spis treści książki
- Preface
- Conventions Used in This Book
- Using Code Examples
- OReilly Online Learning
- How to Contact Us
- Acknowledgments
- 1. Workbooks, Worksheets, and Cells
- 1.1. Using Themes
- 1.2. Using Cell Styles
- 1.3. Formatting Cells
- 1.4. Formatting a Cells Value
- 1.5. Defining a Custom Number Format
- 1.6. Merging Cells
- 1.7. Creating Templates
- 1.8. Protecting Excel Files, Workbooks, Worksheets, and Cells
- 1.9. Using Conditional Formatting
- 1.10. Using the Format Painter
- 1.11. Using Paste Special
- 1.12. Using Auto Fill
- 1.13. Using Custom Lists
- 1.14. Using Flash Fill
- 1.15. Customizing AutoCorrect
- 1.16. Using Notes and Comments
- 1.17. Finding and Selecting Cells and Navigation
- 1.18. Creating a Custom View
- 1.19. Customizing the Ribbon and Ribbon Tabs
- 1.20. Using the Quick Access Toolbar
- 1.21. Using the Accessibility Checker
- 2. References and Structured Data
- 2.1. Using Relative and Absolute References
- 2.2. Using Relative and Absolute References in Conditional Formatting
- 2.3. Using R1C1-Style Cell References
- 2.4. Referencing Another Worksheet or Workbook
- 2.5. Using 3-D References
- 2.6. Naming Cells, Ranges, Constants, and Formulas
- 2.7. Creating Dynamic Named Ranges
- 2.8. Using Data Validation
- 2.9. Creating a Custom Data Validation Rule
- 2.10. Entering Data with a Drop-Down List
- 2.11. Defining Dependent or Cascading Drop-Down Lists
- 2.12. Using a Data-Entry Form
- 2.13. Sorting Data by Value, Format, or Custom List
- 2.14. Filtering Data
- 2.15. Freezing Panes
- 2.16. Using AutoSum
- 2.17. Using Outlines to Add Subtotals and Groups
- 2.18. Using Tables
- 2.19. Using Structured References
- 3. Using Formulas
- 3.1. Using Operators and Order of Precedence
- 3.2. Using Excel in Different Regions and Languages
- 3.3. Using Array Constants
- 3.4. Using Dynamic and Legacy Array Formulas
- 3.5. Using Spill Range References
- 3.6. Preventing Dynamic Array Behavior
- 3.7. Using the Insert Function or Function Builder Tool
- 3.8. Adding Notes to Numeric Formulas
- 3.9. Showing Formulas
- 3.10. Using the Watch Window
- 3.11. Showing Cell Interdependencies
- 3.12. Performing Background Error Checks
- 3.13. Using Error Checking
- 3.14. Tracing Errors
- 3.15. Correcting Error Values
- 3.16. Evaluating Formulas
- 3.17. Changing the Calculation Mode
- 3.18. Setting Rounding Precision
- 3.19. Resolving Circular References
- 4. Math and Engineering
- 4.1. Generating Numbers
- 4.2. Converting Text or a Boolean to a Number
- 4.3. Getting a Numbers Sign and Absolute Value
- 4.4. Counting, Summing, and Averaging Cell Values
- 4.5. Using Criteria to Count, Sum, and Average
- 4.6. Adding and Subtracting Squares of Values
- 4.7. Using Multiplication and Multiples
- 4.8. Finding Quotients, Remainders, and Divisors
- 4.9. Rounding to Decimal Places and Integers
- 4.10. Rounding to Significant Figures and Multiples
- 4.11. Using Powers, Exponents, Square Roots, and Logarithms
- 4.12. Summing a Power Series
- 4.13. Using Factorials, Permutations, and Combinations
- 4.14. Using Trigonometry
- 4.15. Working with Matrices
- 4.16. Converting Between Number Systems
- 4.17. Performing Bitwise Operations
- 4.18. Working with Complex Numbers
- 5. Text Manipulation
- 5.1. Concatenating Text
- 5.2. Using Character Codes
- 5.3. Generating a Sequence of Characters
- 5.4. Generating Random Letters
- 5.5. Finding the Length of a Text String
- 5.6. Finding Text Position in a Text String
- 5.7. Getting Fixed-Width Text from a Text String
- 5.8. Getting Text from a Text String by Delimiter
- 5.9. Getting Text from a Text String by Digit to Nondigit
- 5.10. Replacing, Inserting, and Deleting Text
- 5.11. Removing Extra Characters
- 5.12. Counting Words or Specific Characters
- 5.13. Changing Text Case
- 5.14. Repeating Characters
- 5.15. Converting an Array to Text
- 5.16. Formatting Text as Currency
- 5.17. Including Numeric Values in a Text String
- 5.18. Including Date/Time Values in a Text String
- 6. Dates and Times
- 6.1. Returning the Current Date and Time
- 6.2. Getting Part of a Date/Time Value
- 6.3. Getting the Day of the Week and Week of the Year
- 6.4. Getting the Calendar or Fiscal Quarter
- 6.5. Constructing Dates Using Day, Month, and Year
- 6.6. Constructing Times Using Hours, Minutes, and Seconds
- 6.7. Converting a Text Value to a Date/Time Serial Number
- 6.8. Extracting the Date and Time from a Serial Number
- 6.9. Adding Days, Months, and Years to a Date
- 6.10. Adding Hours, Minutes, and Seconds to a Time
- 6.11. Getting the Last Day of the Month
- 6.12. Calculating the Year Fraction
- 6.13. Calculating the Difference Between Dates and Times
- 6.14. Using Working Days
- 6.15. Getting a Sequence of Dates
- 7. Array, Logic, and Lookup Functions
- 7.1. Getting Unique Values
- 7.2. Sorting an Array
- 7.3. Filtering an Array
- 7.4. Manipulating Arrays
- 7.5. Using Logical True/False Criteria
- 7.6. Evaluating AND and OR Conditions in Array Formulas
- 7.7. Working with Types and Error Values
- 7.8. Choosing Values to Return
- 7.9. Looking Up Exact and Nearest Values
- 7.10. Finding a Matching Values Index
- 7.11. Using an Index to Return a Value
- 7.12. Creating Indirect References to Cells and Ranges
- 7.13. Getting a Cells Address
- 7.14. Using Offset References
- 8. Statistical Analysis
- 8.1. Creating a Frequency Table
- 8.2. Showing Cumulative and Percentage Frequencies
- 8.3. Using a Histogram or Pareto Chart
- 8.4. Calculating Averages
- 8.5. Ranking Numeric Data
- 8.6. Finding the kth Largest or Smallest Value
- 8.7. Dividing Data into Quartiles and Percentiles
- 8.8. Calculating Ranges and Variances
- 8.9. Finding Outliers
- 8.10. Using a Box and Whisker Chart
- 8.11. Calculating Skewness
- 8.12. Calculating Probabilities Using a Probability Table
- 8.13. Calculating Expectation and Variance
- 8.14. Using the Binomial Distribution
- 8.15. Using the Negative Binomial Distribution
- 8.16. Using the Hypergeometric Distribution
- 8.17. Using the Poisson Distribution
- 8.18. Using the Exponential Distribution
- 8.19. Using the Normal Distribution
- 8.20. Using Z-Scores
- 8.21. Calculating a Confidence Interval for the Population Mean
- 8.22. Performing a Chi-Squared (2) Test for Independence
- 8.23. Finding the Line of Best Fit
- 8.24. Getting the Line of Best Fits Equation
- 9. The Analysis ToolPak
- 9.1. Installing the Analysis ToolPak
- 9.2. Generating Descriptive Statistics
- 9.3. Generating Ordinal and Percentage Rank Statistics
- 9.4. Generating a Frequency Distribution
- 9.5. Generating Moving Averages
- 9.6. Using Exponential Smoothing
- 9.7. Generating a Random Sample
- 9.8. Generating a Periodic Sample
- 9.9. Drawing Random Numbers from a Distribution
- 9.10. Generating a Correlation Matrix
- 9.11. Generating a Covariance Matrix
- 9.12. Performing a Linear Regression Analysis
- 9.13. Performing a Two-Sample t-Test
- 9.14. Performing a Two-Sample z-Test
- 9.15. Performing a Paired Two-Sample t-Test
- 9.16. Performing a Two-Sample F-Test for Variances
- 9.17. Performing a One-Way ANOVA Test
- 9.18. Performing a Two-Way ANOVA Test
- 9.19. Running a Fourier Analysis
- 10. Financial Analysis
- 10.1. Calculating Fixed-Rate Loan Payments
- 10.2. Calculating Interest and Principal Loan Payments
- 10.3. Building a Variable Rate Loan Amortization Schedule
- 10.4. Calculating the Term for a Fixed-Rate Loan
- 10.5. Calculating the Principal or Present Value
- 10.6. Converting Between Nominal and Effective Rates
- 10.7. Calculating the Future Value of a Fixed-Rate Lump-Sum Investment
- 10.8. Calculating the Future Value of a Variable-Rate Lump-Sum Investment
- 10.9. Calculating the Future Value of an Investment with Regular Deposits
- 10.10. Meeting Investment Goals
- 10.11. Calculating Net Present Value
- 10.12. Calculating the Internal Rate of Return
- 10.13. Calculating Depreciation
- 10.14. Getting Stock and Currency Data
- 10.15. Getting Historic Stock and Currency Data
- 10.16. Using Stock Charts
- 10.17. Calculating a Stocks Beta
- 10.18. Forecasting Linear and Exponential Growth
- 10.19. Forecasting Seasonal Growth
- 11. PivotTables
- 11.1. Organizing Data for PivotTables
- 11.2. Inserting a PivotTable
- 11.3. Adding Rows, Columns, and Values
- 11.4. Using Secondary Rows
- 11.5. Refreshing a PivotTables Data
- 11.6. Moving a PivotTable
- 11.7. Changing a PivotTables Appearance
- 11.8. Changing the Default Layout
- 11.9. Changing Value Aggregations
- 11.10. Showing Different Value Calculations
- 11.11. Creating Custom Subtotals
- 11.12. Sorting Data
- 11.13. Moving Items Manually
- 11.14. Filtering Data
- 11.15. Using a Filter to Create Multiple PivotTables
- 11.16. Grouping by Date/Time
- 11.17. Grouping by Number
- 11.18. Manually Grouping by Text Values
- 11.19. Including Groups with Missing Data
- 11.20. Changing the Format of Empty Cells
- 11.21. Using Calculated Fields
- 11.22. Using Calculated Fields to Count Items
- 11.23. Using Calculated Items
- 11.24. Referring to Position in a Calculated Item Formula
- 11.25. Changing the Calculated Item Solve Order
- 11.26. Generating a List of Custom Formulas
- 11.27. Changing a PivotTables Data Source
- 11.28. Using the PivotTable Cache
- 11.29. Filtering Multiple PivotTables That Share a Cache
- 11.30. Reducing the Workbook File Size
- 11.31. Reinstating a PivotTables Source Data
- 11.32. Referring to PivotTable Values
- 12. Charts
- 12.1. Using Different Chart Types
- 12.2. Inserting a Chart
- 12.3. Filtering a Chart
- 12.4. Tweaking a Charts Appearance
- 12.5. Adding and Removing Chart Elements
- 12.6. Formatting Chart Elements
- 12.7. Creating Dynamic Titles and Labels
- 12.8. Customizing Data Label Text
- 12.9. Controlling Chart Axes and Gridlines
- 12.10. Displaying Negative Values
- 12.11. Using Pictures in Column Charts
- 12.12. Formatting Pie of Pie and Bar of Pie Charts
- 12.13. Formatting a Histogram Chart
- 12.14. Specifying a Combination Charts Chart Types
- 12.15. Handling Empty Cells
- 12.16. Basing a Chart on Noncontiguous Data
- 12.17. Changing a Data Series Name and Legend Entry
- 12.18. Adding a Series or Changing the Data Source
- 12.19. Basing a Chart on a Dynamic Named Range
- 12.20. Inserting a PivotChart
- 12.21. Creating a Gantt Chart
- 12.22. Creating and Using Chart Templates
- 13. Graphics, Sparklines, and 3D Maps
- 13.1. Inserting Symbols
- 13.2. Inserting Equations
- 13.3. Inserting Shapes
- 13.4. Using the Draw Tool
- 13.5. Using SmartArt
- 13.6. Inserting Pictures
- 13.7. Grouping Objects
- 13.8. Moving and Sizing Objects with Cells
- 13.9. Inserting a Linked Picture
- 13.10. Using Sparklines
- 13.11. Using Sparkline Groups
- 13.12. Using 3D Maps
- 13.13. Creating Videos with 3D Maps
- 14. What-If Analysis
- 14.1. Creating a One-Variable Data Table
- 14.2. Creating a Row-Oriented One-Variable Data Table
- 14.3. Creating a Two-Variable Data Table
- 14.4. Editing Data Tables
- 14.5. Using Scenario Manager
- 14.6. Merging Scenarios
- 14.7. Generating Scenario Summaries
- 14.8. Using Goal Seek
- 14.9. Finding Multiple Solutions with Goal Seek
- 14.10. Handling Discontinuous Formulas with Goal Seek
- 14.11. Enabling Solver
- 14.12. Solving an Optimization Problem with Solver
- 14.13. Using Integer-Only Constraints with Solver
- 14.14. Using Binary-Only Constraints with Solver
- 14.15. Making Changing Cells All Different with Solver
- 14.16. Handling Discontinuities with Solver
- 14.17. Finding Multiple Solutions with Solver
- 14.18. Finding a Formulas Global Minimum or Maximum with Solver
- 14.19. Adjusting Solvers Options
- 14.20. Saving and Loading Solver Parameters
- 14.21. Saving Solver-Generated Scenarios
- 14.22. Displaying Solver Reports
- 15. Power Query
- 15.1. Getting and Loading Data
- 15.2. Getting and Loading Data from Files in a Folder
- 15.3. Specifying Where to Load Data To
- 15.4. Editing Data Source Settings and Security
- 15.5. Refreshing a Querys Data
- 15.6. Managing Queries
- 15.7. Editing a Query
- 15.8. Managing a Querys Steps
- 15.9. Managing Columns
- 15.10. Using Data Types
- 15.11. Sorting and Filtering Data
- 15.12. Filtering Files When Loading Data from a Folder
- 15.13. Removing Duplicates, Blank Rows, and Errors
- 15.14. Transforming Data in Columns
- 15.15. Splitting and Merging Columns
- 15.16. Pivoting Columns
- 15.17. Unpivoting Columns
- 15.18. Transforming Structured Columns
- 15.19. Returning a Value or List
- 15.20. Adding New Columns
- 15.21. Adding a Column Based on Examples
- 15.22. Adding a Conditional Column
- 15.23. Adding a Custom Column
- 15.24. Using Parameters
- 15.25. Creating a Custom Function
- 15.26. Adding a Column by Invoking a Custom Function
- 15.27. Duplicating a Query
- 15.28. Referencing a Query
- 15.29. Appending Data from Multiple Queries
- 15.30. Merging Data from Multiple Queries
- 15.31. Editing a Querys M Code
- 16. Power Pivot and the Data Model
- 16.1. Installing Power Pivot
- 16.2. Adding Data to the Data Model
- 16.3. Managing Power Pivot Data Connections
- 16.4. Viewing and Managing the Data Models Tables
- 16.5. Refreshing the Data Models Data
- 16.6. Working with Table Columns
- 16.7. Creating and Editing Relationships
- 16.8. Adding a Calculated Column
- 16.9. Basing a PivotTable or PivotChart on Data Model Tables
- 16.10. Inserting Measures
- 16.11. Using KPIs
- 16.12. Creating Hierarchies
- 16.13. Creating a Date Table
- 16.14. Using Named Sets
- 16.15. Converting a PivotTable to Formulas
- 16.16. Using Cube Formulas
- 16.17. Filtering Cube Formulas with Slicers and Timelines
- 17. LET, LAMBDA, and LAMBDA
Helper Functions
- 17.1. Improving Formula Efficiency
- 17.2. Writing and Testing a LAMBDA Formula
- 17.3. Making LAMBDA Arguments Optional
- 17.4. Defining a Custom LAMBDA Function
- 17.5. Writing Recursive LAMBDA Formulas
- 17.6. Copying a Custom LAMBDA Function to Another Workbook
- 17.7. Applying a LAMBDA Formula to Each Column
- 17.8. Applying a LAMBDA Formula to Each Row
- 17.9. Creating an Array of Calculated Values
- 17.10. Transforming the Values in Arrays
- 17.11. Calculating Cumulative Values
- 17.12. Returning the Final Value of a Cumulative Calculation
- 18. Developer Tools: Macros, VBA, Controls, and XML
- 18.1. Showing the Developer Tab
- 18.2. Recording a Macro
- 18.3. Using a Personal Macro Workbook
- 18.4. Editing a Macros Options
- 18.5. Running a Macro
- 18.6. Viewing or Editing a Macros VBA Code
- 18.7. Using Absolute and Relative References
- 18.8. Creating a Macro by Writing VBA
- 18.9. Creating a Custom VBA Function
- 18.10. Using Worksheet and Workbook Events
- 18.11. Overriding Keystrokes with OnKey
- 18.12. Scheduling Code with OnTime
- 18.13. Deleting a Macro or Function
- 18.14. Copying Code to Another VBA Project
- 18.15. Debugging VBA Code
- 18.16. Using Built-in Dialog Boxes
- 18.17. Using Form Controls
- 18.18. Using ActiveX Controls
- 18.19. Creating a UserForm
- 18.20. Creating a Custom Excel Add-in
- 18.21. Setting Security and Privacy Options
- 18.22. Importing and Exporting XML
- Index
O'Reilly Media - inne książki
-
Promocja
 Becoming a tech lead is one of the most challenging transitions in a technical career. You're no longer just writing code; now you're guiding people, aligning teams, and translating strategy into execution. Suddenly, your calendar's packed, Slack is blowing up, and you're still somehow expected to ship code. You're not building systems anymore, you
-
-
ebook
135 pkt
(95,40 zł najniższa cena z 30 dni)
135.15 zł
159.00 zł (-15%) -
-
Promocja
 To prepare legacy software for the future, it's essential to modernize it. Domain-Driven Transformation provides an effective approach for transforming large legacy systems—either by breaking them into microservices or by converting them into maintainable modular monoliths. In this guide, Carola Lilienthal and Henning Schwentner present their metho
-
-
ebook
203 pkt
(143,40 zł najniższa cena z 30 dni)
203.15 zł
239.00 zł (-15%) -
-
Promocja
 Elevate your AI system performance capabilities with this definitive guide to maximizing efficiency across every layer of your AI infrastructure. In today's era of ever-growing generative models, AI Systems Performance Engineering provides engineers, researchers, and developers with a hands-on set of actionable optimization strategies. Learn to co-
-
-
ebook
279 pkt
(197,40 zł najniższa cena z 30 dni)
279.65 zł
329.00 zł (-15%) -
-
Promocja
 In the fast-paced world of software engineering, developing technical skills often takes precedence. However, if you're seeking career advancement, enhancing your technical skills alone is not enough; you also need to deepen your empathy for users—a skill frequently overlooked in traditional engineering roles. Understanding user needs and the broad
-
-
ebook
203 pkt
(143,40 zł najniższa cena z 30 dni)
203.15 zł
239.00 zł (-15%) -
-
Promocja
 As a Java enterprise developer or architect, you know that embracing AI isn't just optional—it's critical to keeping your competitive edge. The question is, how can you skillfully incorporate these groundbreaking AI technologies into your applications without getting mired in complexity? Enter this clear-cut, no-nonsense guide to integrating genera
-
-
ebook
186 pkt
(131,40 zł najniższa cena z 30 dni)
186.15 zł
219.00 zł (-15%) -
-
Promocja
 Get up to speed on a new unified approach to building machine learning (ML) systems with a feature store. Using this practical book, data scientists and ML engineers will learn in detail how to develop and operate batch, real-time, and agentic ML systems. Author Jim Dowling introduces fundamental principles and practices for developing, testing, an
-
-
ebook
228 pkt
(161,40 zł najniższa cena z 30 dni)
228.65 zł
269.00 zł (-15%) -
-
Promocja
 What do you need to know to be a successful software engineer? Undergraduate curricula and bootcamps may teach the fundamentals of algorithms and writing code, but they rarely cover topics vital to your career advancement. With this practical book, you'll learn the skills you need to succeed and thrive. Authors Nathaniel Schutta and Dan Vega guide
-
-
ebook
186 pkt
(131,40 zł najniższa cena z 30 dni)
186.15 zł
219.00 zł (-15%) -
-
Promocja
 The third edition of this trusted guide demonstrates the practical advantages of test-driven development (TDD) with Python and describes how to develop a real web application. You'll learn how to write and run tests before building each part of your app and then develop the minimum amount of code required to pass those tests. The result? Clean code
-
-
ebook
228 pkt
(161,40 zł najniższa cena z 30 dni)
228.65 zł
269.00 zł (-15%) -
-
Promocja
 The potential of machine learning today is extraordinary, yet many aspiring developers and tech professionals find themselves daunted by its complexity. Whether you're looking to enhance your skill set and apply machine learning to real-world projects or are simply curious about how AI systems function, this book is your jumping-off place. With an
-
-
ebook
254 pkt
(179,40 zł najniższa cena z 30 dni)
254.15 zł
299.00 zł (-15%) -
-
Promocja
 Many engineers assume their organization doesn't have an engineering strategy—when in fact, they often do. It just may not be working. In Crafting Engineering Strategy, Will Larson (author of An Elegant Puzzle, Staff Engineer, and The Engineering Executive's Primer) offers a practical, example-rich guide to navigating technical and organizational c
-
-
ebook
118 pkt
(83,40 zł najniższa cena z 30 dni)
118.15 zł
139.00 zł (-15%) -
Dzięki opcji "Druk na żądanie" do sprzedaży wracają tytuły Grupy Helion, które cieszyły sie dużym zainteresowaniem, a których nakład został wyprzedany.
Dla naszych Czytelników wydrukowaliśmy dodatkową pulę egzemplarzy w technice druku cyfrowego.
Co powinieneś wiedzieć o usłudze "Druk na żądanie":
- usługa obejmuje tylko widoczną poniżej listę tytułów, którą na bieżąco aktualizujemy;
- cena książki może być wyższa od początkowej ceny detalicznej, co jest spowodowane kosztami druku cyfrowego (wyższymi niż koszty tradycyjnego druku offsetowego). Obowiązująca cena jest zawsze podawana na stronie WWW książki;
- zawartość książki wraz z dodatkami (płyta CD, DVD) odpowiada jej pierwotnemu wydaniu i jest w pełni komplementarna;
- usługa nie obejmuje książek w kolorze.
Masz pytanie o konkretny tytuł? Napisz do nas: sklep@ebookpoint.pl
Książka drukowana


Oceny i opinie klientów: Excel Cookbook Dawn Griffiths
(0)