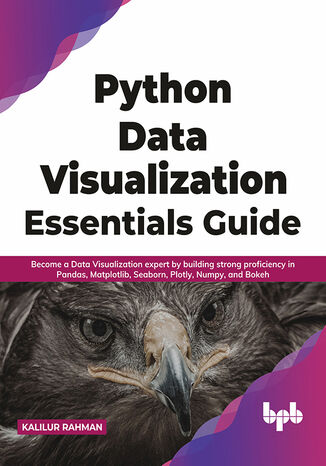
Build your data science skills. Start data visualization Using Python. Right away. Become a good data analyst by creating quality data visualizations using Python.
Key Features
Exciting coverage on loads of Python libraries, including Matplotlib, Seaborn, Pandas, and Plotly.
Tons of examples, illustrations, and use-cases to demonstrate visual storytelling of varied datasets.
Covers a strong fundamental understanding of exploratory data analysis (EDA), statistical modeling, and data mining.
Description
Data visualization plays a major role in solving data science challenges with various capabilities it offers. This book aims to equip you with a sound knowledge of Python in conjunction with the concepts you need to master to succeed as a data visualization expert.
The book starts with a brief introduction to the world of data visualization and talks about why it is important, the history of visualization, and the capabilities it offers. You will learn how to do simple Python-based visualization with examples with progressive complexity of key features. The book starts with Matplotlib and explores the power of data visualization with over 50 examples. It then explores the power of data visualization using one of the popular exploratory data analysis-oriented libraries, Pandas.
The book talks about statistically inclined data visualization libraries such as Seaborn. The book also teaches how we can leverage bokeh and Plotly for interactive data visualization. Each chapter is enriched and loaded with 30+ examples that will guide you in learning everything about data visualization and storytelling of mixed datasets.
What you will learn
Learn to work with popular Python libraries and frameworks, including Seaborn, Bokeh, and Plotly.
Practice your data visualization understanding across numerous datasets and real examples.
Learn to visualize geospatial and time-series datasets.
Perform correlation and EDA analysis using Pandas and Matplotlib.
Who this book is for
This book is for all data analytics professionals, data scientists, and data mining hobbyists who want to be strong data visualizers by learning all the popular Python data visualization libraries. Prior working knowledge of Python is assumed.
Table of Contents
1. Introduction to Data Visualization
2. Why Data Visualization
3. Various Data Visualization Elements and Tools
4. Using Matplotlib with Python
5. Using NumPy and Pandas for Plotting
6. Using Seaborn for Visualization
7. Using Bokeh with Python
8. Using Plotly, Folium, and Other Tools for Data Visualization
9. Hands-on Examples and Exercises, Case Studies, and Further Resources
About the Authors
Kallur Rahman is an IT industry leader with over 2 decades of experience in software development, testing, program/ project management, and management consultancy. He has been a developer, designer, technical architect, test program manager, delivery unit head, IT Services, and COE/Factory Services leader of various complexity spanning telecommunications, Life Sciences, Retail, and Healthcare Industries. He has a masters degree in Business Administration preceded by an Engineering degree in Computer Science. He has counseled CxO level executives in market-leading corporations for testing, business and technology transformation programs. As a thought-leader, he is a frequent invitee at several industry events spanning technical and domain-focused themes.
He is a believer in Knowledge is Power and is passionate about authoring and sharing his knowledge. He has published over 200 articles across LinkedIn, DevOps.Com, and other leading magazines.
He is additionally an active quizzing aficionado who engages and contributes at corporate level quizzing.
LinkedIn Bio: https://www.linkedin.com/in/kalilurrahman/













Oceny i opinie klientów: Python Data Visualization Essentials Guide Kalilur Rahman
(0)