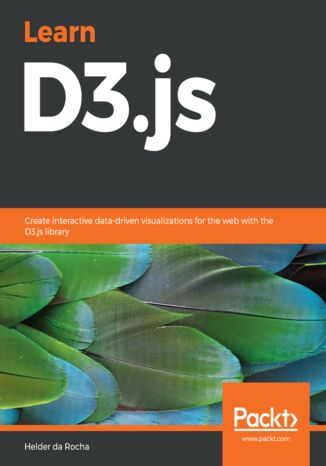
Learn D3.js. Create interactive data-driven visualizations for the web with the D3.js library Helder da Rocha

- Autor:
- Helder da Rocha
- Wydawnictwo:
- Packt Publishing
- Ocena:
- Stron:
- 650
- Dostępne formaty:
-
PDFePubMobi
Opis
książki
:
Learn D3.js. Create interactive data-driven visualizations for the web with the D3.js library
D3 is not a charting library. It doesn’t contain any pre-defined chart types, but can be used to create whatever visual representations of data you can imagine. The goal of this book is to introduce D3 and provide a learning path so that you obtain a solid understanding of its fundamental concepts, learn to use most of its modules and functions, and gain enough experience to create your own D3 visualizations. You will learn how to create bar, line, pie and scatter charts, trees, dendograms, treemaps, circle packs, chord/ribbon diagrams, sankey diagrams, animated network diagrams, and maps using different geographical projections. Fundamental concepts are explained in each chapter and then applied to a larger example in step-by-step tutorials, complete with full code, from hundreds of examples you can download and run.
This book covers D3 version 5 and is based on ES2015 JavaScript.
Wybrane bestsellery
Packt Publishing - inne książki
Dzięki opcji "Druk na żądanie" do sprzedaży wracają tytuły Grupy Helion, które cieszyły sie dużym zainteresowaniem, a których nakład został wyprzedany.
Dla naszych Czytelników wydrukowaliśmy dodatkową pulę egzemplarzy w technice druku cyfrowego.
Co powinieneś wiedzieć o usłudze "Druk na żądanie":
- usługa obejmuje tylko widoczną poniżej listę tytułów, którą na bieżąco aktualizujemy;
- cena książki może być wyższa od początkowej ceny detalicznej, co jest spowodowane kosztami druku cyfrowego (wyższymi niż koszty tradycyjnego druku offsetowego). Obowiązująca cena jest zawsze podawana na stronie WWW książki;
- zawartość książki wraz z dodatkami (płyta CD, DVD) odpowiada jej pierwotnemu wydaniu i jest w pełni komplementarna;
- usługa nie obejmuje książek w kolorze.
Masz pytanie o konkretny tytuł? Napisz do nas: sklep@ebookpoint.pl
Książka drukowana















Oceny i opinie klientów: Learn D3.js. Create interactive data-driven visualizations for the web with the D3.js library Helder da Rocha
(0)