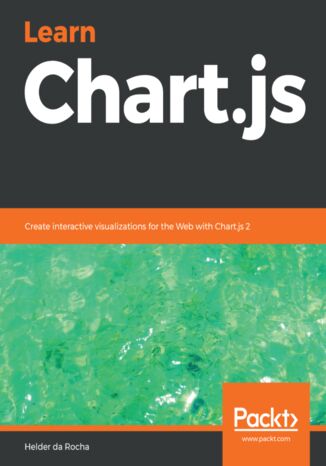
Learn Chart.js. Create interactive visualizations for the Web with Chart.js 2 Helder da Rocha

- Autor:
- Helder da Rocha
- Wydawnictwo:
- Packt Publishing
- Ocena:
- Stron:
- 284
- Dostępne formaty:
-
PDFePubMobi
Opis
książki
:
Learn Chart.js. Create interactive visualizations for the Web with Chart.js 2
This book guides the reader through dozens of practical examples, complete with code you can run and modify as you wish. It is a practical hands-on introduction to Chart.js. If you have basic knowledge of HTML, CSS and JavaScript you can learn to create beautiful interactive Web Canvas-based visualizations for your data using Chart.js. This book will help you set up Chart.js in a Web page and show how to create each one of the eight Chart.js chart types. You will also learn how to configure most properties that override Chart’s default styles and behaviors. Practical applications of Chart.js are exemplified using real data files obtained from public data portals. You will learn how to load, parse, filter and select the data you wish to display from those files. You will also learn how to create visualizations that reveal patterns in the data. This book is based on Chart.js version 2.7.3 and ES2015 JavaScript.
By the end of the book, you will be able to create beautiful, efficient and interactive data visualizations for the Web using Chart.js.
Wybrane bestsellery
Packt Publishing - inne książki
Dzięki opcji "Druk na żądanie" do sprzedaży wracają tytuły Grupy Helion, które cieszyły sie dużym zainteresowaniem, a których nakład został wyprzedany.
Dla naszych Czytelników wydrukowaliśmy dodatkową pulę egzemplarzy w technice druku cyfrowego.
Co powinieneś wiedzieć o usłudze "Druk na żądanie":
- usługa obejmuje tylko widoczną poniżej listę tytułów, którą na bieżąco aktualizujemy;
- cena książki może być wyższa od początkowej ceny detalicznej, co jest spowodowane kosztami druku cyfrowego (wyższymi niż koszty tradycyjnego druku offsetowego). Obowiązująca cena jest zawsze podawana na stronie WWW książki;
- zawartość książki wraz z dodatkami (płyta CD, DVD) odpowiada jej pierwotnemu wydaniu i jest w pełni komplementarna;
- usługa nie obejmuje książek w kolorze.
Masz pytanie o konkretny tytuł? Napisz do nas: sklep@ebookpoint.pl
Książka drukowana













Oceny i opinie klientów: Learn Chart.js. Create interactive visualizations for the Web with Chart.js 2 Helder da Rocha
(0)