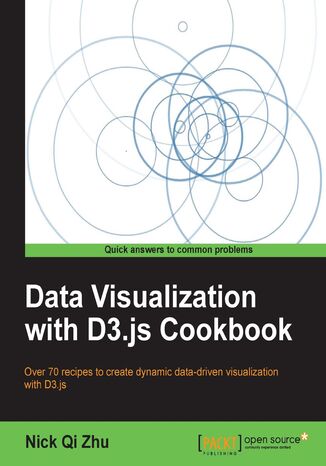
Data Visualization with D3.js Cookbook. Turn your digital data into dynamic graphics with this exciting, leading-edge cookbook. Packed with recipes and practical guidance it will quickly make you a proficient user of the D3 JavaScript library Nick Zhu

- Autor:
- Nick Zhu
- Wydawnictwo:
- Packt Publishing
- Ocena:
- Stron:
- 338
- Dostępne formaty:
-
PDFePubMobi
Opis
książki
:
Data Visualization with D3.js Cookbook. Turn your digital data into dynamic graphics with this exciting, leading-edge cookbook. Packed with recipes and practical guidance it will quickly make you a proficient user of the D3 JavaScript library
Data Visualization with D3.js Cookbook is packed with practical recipes to help you learn every aspect of data visualization with D3.
Data Visualization with D3.js Cookbook is designed to provide you with all the guidance you need to get to grips with data visualization with D3. With this book, you will create breathtaking data visualization with professional efficiency and precision with the help of practical recipes, illustrations, and code samples.
Data Visualization with D3.js Cookbook starts off by touching upon data visualization and D3 basics before gradually taking you through a number of practical recipes covering a wide range of topics you need to know about D3.
You will learn the fundamental concepts of data visualization, functional JavaScript, and D3 fundamentals including element selection, data binding, animation, and SVG generation. You will also learn how to leverage more advanced techniques such as custom interpolators, custom tweening, timers, the layout manager, force manipulation, and so on. This book also provides a number of pre-built chart recipes with ready-to-go sample code to help you bootstrap quickly.
Wybrane bestsellery
Packt Publishing - inne książki
Dzięki opcji "Druk na żądanie" do sprzedaży wracają tytuły Grupy Helion, które cieszyły sie dużym zainteresowaniem, a których nakład został wyprzedany.
Dla naszych Czytelników wydrukowaliśmy dodatkową pulę egzemplarzy w technice druku cyfrowego.
Co powinieneś wiedzieć o usłudze "Druk na żądanie":
- usługa obejmuje tylko widoczną poniżej listę tytułów, którą na bieżąco aktualizujemy;
- cena książki może być wyższa od początkowej ceny detalicznej, co jest spowodowane kosztami druku cyfrowego (wyższymi niż koszty tradycyjnego druku offsetowego). Obowiązująca cena jest zawsze podawana na stronie WWW książki;
- zawartość książki wraz z dodatkami (płyta CD, DVD) odpowiada jej pierwotnemu wydaniu i jest w pełni komplementarna;
- usługa nie obejmuje książek w kolorze.
Masz pytanie o konkretny tytuł? Napisz do nas: sklep@ebookpoint.pl
Książka drukowana














Oceny i opinie klientów: Data Visualization with D3.js Cookbook. Turn your digital data into dynamic graphics with this exciting, leading-edge cookbook. Packed with recipes and practical guidance it will quickly make you a proficient user of the D3 JavaScript library Nick Zhu
(0)