ODBIERZ TWÓJ BONUS :: »

Tableau: Creating Interactive Data Visualizations. Creating Interactive Data Visualizations

Język publikacji: angielskim
Tableau: Creating Interactive Data Visualizations. Creating Interactive Data Visualizations Matt Floyd, Jen Stirrup, Ashley Ohmann, Ashutosh Nandeshwar - okladka książki
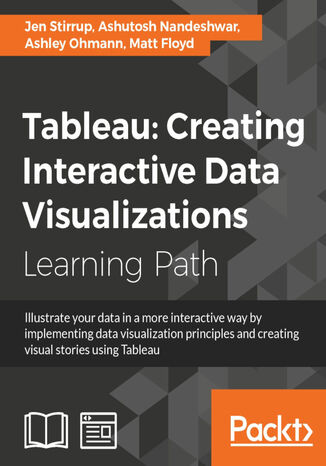
Tableau: Creating Interactive Data Visualizations. Creating Interactive Data Visualizations Matt Floyd, Jen Stirrup, Ashley Ohmann, Ashutosh Nandeshwar - okladka książki

Ocena:
Bądź pierwszym, który oceni tę książkę
Dostępne formaty:
     PDF
     ePub
     Mobi

Ebook 29,90 zł najniższa cena z 30 dni

289,00 zł (-10%)
260,10 zł

Dodaj do koszyka lub Kup na prezent Kup 1-kliknięciem

29,90 zł najniższa cena z 30 dni

Poleć tę książkę znajomemu Poleć tę książkę znajomemu!!

Przenieś na półkę

Do przechowalni

Prezent last minute w ebookpoint.pl
With increasing interest for data visualization in the media, businesses are looking to create effective dashboards that engage as well as communicate the truth of data. Tableau makes data accessible to everyone, and is a great way of sharing enterprise dashboards across the business. Tableau is a revolutionary toolkit that lets you simply and effectively create high-quality data visualizations.

This course starts with making you familiar with its features and enable you to develop and enhance your dashboard skills, starting with an overview of what dashboard is, followed by how you can collect data using various mathematical formulas. Next, you'll learn to filter and group data, as well as how to use various functions to present the data in an appealing and accurate way.

In the first module, you will learn how to use the key advanced string functions to play with data and images. You will be walked through the various features of Tableau including dual axes, scatterplot matrices, heat maps, and sizing.In the second module, you’ll start with getting your data into Tableau, move onto generating progressively complex graphics, and end with the finishing touches and packaging your work for distribution. This module is filled with practical examples to help you create filled maps, use custom markers, add slider selectors, and create dashboards. You will learn how to manipulate data in various ways by applying various filters, logic, and calculating various aggregate measures. Finally, in the third module, you learn about Tableau Public using which allows readers to explore data associations in multiple-sourced public data, and uses state-of-the-art dashboard and chart graphics to immerse the users in an interactive experience. In this module, the readers can quickly gain confidence in understanding and expanding their visualization, creation knowledge, and quickly create interesting, interactive data visualizations to bring a richness and vibrancy to complex articles.

The course provides a great overview for beginner to intermediate Tableau users, and covers the creation of data visualizations of varying complexities.

Wybrane bestsellery

O autorach książki

Matt Floyd has worked in the software industry since 2000 and has held career roles from project management to technical writing and business intelligence analysis. His career has spanned many industries, including environment, healthcare, pharmaceuticals, and insurance. Matt's hands-on experience with Tableau started in 2008 after evaluating alternatives to reporting and analytical software used by his clients. Since then, he has been a technical writer, implementation engineer, consultant, developer, and analyst in BI projects. His passion for Tableau stems from his fascination of discovery through data and the art, science, and power of data visualization. He is currently interested in text mining and the combination of that data with powerful visualizations that tell fascinating stories. He and his family live in metro Atlanta, and when not stuck in traffic, he sometimes offers musings on his blog covering various visualization topics at https://floydmatt.com/.
Jen Stirrup is a data strategist and technologist, a Microsoft Most Valuable Professional (MVP), and a Microsoft Regional Director, a tech community advocate, a public speaker and blogger, a published author, and a keynote speaker. Jen is the founder of a boutique consultancy based in the UK, Data Relish, which focuses on delivering successful business intelligence and artificial intelligence solutions that add real value to customers worldwide. She has featured on the BBC as a guest expert on topics relating to data.
Ashley Ohmann started her career in technology as a Flash and HTML developer at the Emory University School of Medicine while studying Classics as an undergraduate at Emory University. After learning how to write SQL to help create a fraud detection system for a client, she pursued information management and data analytics as a vocation. While working for a multinational manufacturing company, she was asked to evaluate Tableau Desktop and Tableau Server; consequently, her team became one of the first to implement the suite of tools for their enterprise. Ashley's career with Tableau's products has included work as a consultant, trainer, and a professional services practice director. She is a frequent contributor to the San Francisco and Phoenix Tableau User Groups. A native of Highlands, NC and Atlanta, GA, Ashley is a proud alumna of Rabun Gap Nacoochee School. She also studied German and Chemistry at Mount Holyoke College before graduating from Emory. Ashley's roots go back to south Georgia; she grew up listening to the stories of her large extended family, which inspired her to spend her career helping other people learn how to tell their own stories using a variety of media. Currently, she lives in the Pacific Northwest with her family, where they enjoy skiing, the beauty of God's great creation, and practicing permaculture on their 10 acre farm.
Ashutosh R. Nandeshwar has extensive experience in data mining, machine learning, and information visualization. He is one of the few analytics professionals in the higher education industry who have developed analytical solutions for all stages of the student lifecycle (from recruitment to giving). He enjoys speaking to technical and non-technical audiences about the power of data as well as ranting about data professionals' chasing of "interesting" things. He received his PhD/MS from West Virginia University and BE from Nagpur University, all in Industrial Engineering. You can follow him on Twitter, @n_ashutosh, and on his website, https://www.nandeshwar.info.

Matt Floyd, Jen Stirrup, Ashley Ohmann, Ashutosh Nandeshwar - pozostałe książki

Packt Publishing - inne książki

Zamknij

Przenieś na półkę
Dodano produkt na półkę
Usunięto produkt z półki
Przeniesiono produkt do archiwum
Przeniesiono produkt do biblioteki

Zamknij

Wybierz metodę płatności

Ebook
260,10 zł
Dodaj do koszyka
Sposób płatności