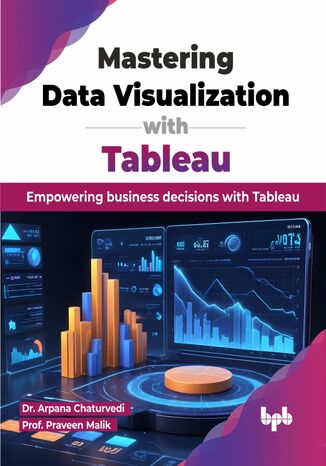
Mastering Data Visualization with Tableau Dr. Arpana Chaturvedi, Prof. Praveen Malik
- Autorzy:
- Dr. Arpana Chaturvedi, Prof. Praveen Malik
- Wydawnictwo:
- BPB Publications
- Ocena:
- Stron:
- 488
- Dostępne formaty:
-
ePubMobi
Opis
książki
:
Mastering Data Visualization with Tableau
"Mastering Data Visualization with Tableau is an invaluable book that will help you become more knowledgeable and elevate your understanding and skills in data visualization using Tableau which is one of the leading tools in the industry. This comprehensive resource covers the basics of visual analytics, explaining both the theory and practical ways to turn raw data into useful insights.
You will start with Tableau Desktop by learning to download it, navigate the interface, and connect to data sources. The book teaches you to create and format basic charts, adding interactivity with parameters, sets, sorting, and filtering. You will explore calculations and advanced visualizations like bar-in-bar charts and maps. It covers designing interactive dashboards, using text and images for storytelling, and sharing work via PDFs and Tableau Public. The book ends with AI features in Tableau and hands-on exercises to practice.
Through this book, readers can gain the confidence to handle complex datasets, apply advanced visualization techniques, and harness Tableau's full potential to make informed decisions faster and with greater accuracy. This guide is your pathway to becoming proficient in the art and science of data visualization with Tableau. Key Features
Detailed exploration of Tableau, Tableau interface, dimensions, measures, and other visualization tools.
Techniques for interactive data visualization using actions, filters, sets, parameters, groups, and hierarchy.
Advanced graphing techniques and dynamic visualization strategies, calculated fields, table calculations, and LOD.
Comprehensive integration of AI to improve data analysis. What you will learn
Tableau for complex data visualizations and apply predictive analytics. Clean and prepare data efficiently and create interactive dashboards that drive strategic business decisions.
Advanced charts like bar-in-bar, profit calendar, and map visualizations.
Gain practical hands-on experience with a question bank based on various industry use cases, enhancing your ability to tackle real-world data challenges. Who this book is for
This book is an excellent resource for students from any discipline, data scientists, business analysts, and professionals eager to master Tableau for comprehensive insights, effective dashboards, and advanced data analysis. Table of Contents
1. Introduction to Data Visualization and Visual Analytics
2. Getting Started with Tableau Desktop
3. Connecting to Data Sources and Data Interpretation
4. Basic Data Visualization and Graphs in Tableau
5. Dynamic Interaction: Parameters, Set, Hierarchies, and Sorting
6. Dynamic Interaction Using Filter and Action on Worksheet
7. Advanced Data Visualization and Graphs in Tableau
8. Calculations in Tableau
9. Dashboard Design and Story Creation
10. Enhancing Dashboards: Sharing and Collaboration
11. Integrating AI in Tableau: An Overview
12. Data Cleaning and Preparation Using Tableau Prep Builder
Wybrane bestsellery
BPB Publications - inne książki
Dzięki opcji "Druk na żądanie" do sprzedaży wracają tytuły Grupy Helion, które cieszyły sie dużym zainteresowaniem, a których nakład został wyprzedany.
Dla naszych Czytelników wydrukowaliśmy dodatkową pulę egzemplarzy w technice druku cyfrowego.
Co powinieneś wiedzieć o usłudze "Druk na żądanie":
- usługa obejmuje tylko widoczną poniżej listę tytułów, którą na bieżąco aktualizujemy;
- cena książki może być wyższa od początkowej ceny detalicznej, co jest spowodowane kosztami druku cyfrowego (wyższymi niż koszty tradycyjnego druku offsetowego). Obowiązująca cena jest zawsze podawana na stronie WWW książki;
- zawartość książki wraz z dodatkami (płyta CD, DVD) odpowiada jej pierwotnemu wydaniu i jest w pełni komplementarna;
- usługa nie obejmuje książek w kolorze.
Masz pytanie o konkretny tytuł? Napisz do nas: sklep@ebookpoint.pl
Książka drukowana













Oceny i opinie klientów: Mastering Data Visualization with Tableau Dr. Arpana Chaturvedi, Prof. Praveen Malik
(0)