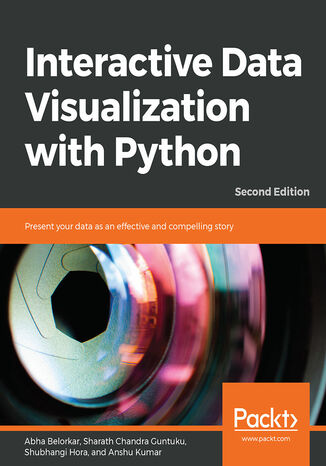
Interactive Data Visualization with Python. Present your data as an effective and compelling story - Second Edition Abha Belorkar, Sharath Chandra Guntuku, Shubhangi Hora, Anshu Kumar

- Autorzy:
- Abha Belorkar, Sharath Chandra Guntuku, Shubhangi Hora, Anshu Kumar
- Wydawnictwo:
- Packt Publishing
- Ocena:
- Stron:
- 362
- Dostępne formaty:
-
PDFePubMobi
Opis
książki
:
Interactive Data Visualization with Python. Present your data as an effective and compelling story - Second Edition
You'll begin by learning how to draw various plots with Matplotlib and Seaborn, the non-interactive data visualization libraries. You'll study different types of visualizations, compare them, and find out how to select a particular type of visualization to suit your requirements. After you get a hang of the various non-interactive visualization libraries, you'll learn the principles of intuitive and persuasive data visualization, and use Bokeh and Plotly to transform your visuals into strong stories. You'll also gain insight into how interactive data and model visualization can optimize the performance of a regression model.
By the end of the course, you'll have a new skill set that'll make you the go-to person for transforming data visualizations into engaging and interesting stories.
Wybrane bestsellery
Packt Publishing - inne książki
Dzięki opcji "Druk na żądanie" do sprzedaży wracają tytuły Grupy Helion, które cieszyły sie dużym zainteresowaniem, a których nakład został wyprzedany.
Dla naszych Czytelników wydrukowaliśmy dodatkową pulę egzemplarzy w technice druku cyfrowego.
Co powinieneś wiedzieć o usłudze "Druk na żądanie":
- usługa obejmuje tylko widoczną poniżej listę tytułów, którą na bieżąco aktualizujemy;
- cena książki może być wyższa od początkowej ceny detalicznej, co jest spowodowane kosztami druku cyfrowego (wyższymi niż koszty tradycyjnego druku offsetowego). Obowiązująca cena jest zawsze podawana na stronie WWW książki;
- zawartość książki wraz z dodatkami (płyta CD, DVD) odpowiada jej pierwotnemu wydaniu i jest w pełni komplementarna;
- usługa nie obejmuje książek w kolorze.
Masz pytanie o konkretny tytuł? Napisz do nas: sklep@ebookpoint.pl
Książka drukowana




















Oceny i opinie klientów: Interactive Data Visualization with Python. Present your data as an effective and compelling story - Second Edition Abha Belorkar, Sharath Chandra Guntuku, Shubhangi Hora, Anshu Kumar
(0)