ODBIERZ TWÓJ BONUS :: »

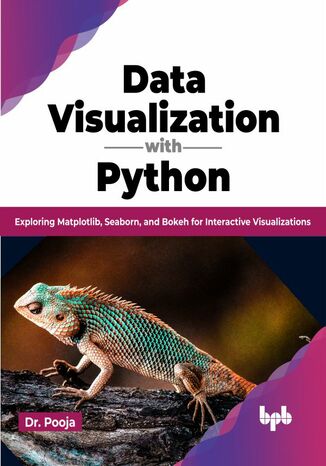
Data Visualization with Python Dr. Pooja

Język publikacji: angielskim
Autor:
Dr. Pooja
Ocena:
Bądź pierwszym, który oceni tę książkę
Stron:
304
Dostępne formaty:
     ePub
     Mobi
Czytaj fragment

Ebook 39,90 zł najniższa cena z 30 dni

89,90 zł (-10%)
80,91 zł

Dodaj do koszyka lub Kup na prezent Kup 1-kliknięciem

39,90 zł najniższa cena z 30 dni

Przenieś na półkę

Do przechowalni

Transforming data into actionable insights using Python

Key Features
Gain a comprehensive understanding of data visualization and exploratory data analysis (EDA) using Python.
Discover valuable insights and patterns in data through visual analysis.
Master the art of effectively communicating complex concepts by creating compelling and impactful data visualizations.

Description
Python is a popular programming language for data visualization due to its rich ecosystem of libraries and tools. If you're interested in delving into data visualization in Python, this book is an excellent resource to begin your journey.

With Matplotlib, you'll master the art of creating a wide range of charts, plots, and graphs. From basic line plots to complex 3D visualizations, you'll learn how to transform raw data into engaging visuals that tell compelling stories. Dive into Seaborn, a high-level library built on top of Matplotlib, and discover how to effortlessly create beautiful and informative statistical visualizations effortlessly. From heatmaps to distribution plots, you'll unleash the full potential of Seaborn in your data analysis endeavors. Lastly, you will learn how to unleash the true potential of Bokeh and create compelling data visualizations that allow users to explore and interact with data dynamically.

By the end of the book, you will have acquired the knowledge and skills necessary to create a diverse range of visualizations proficiently.

What you will learn
Utilize Matplotlib, Seaborn, and Bokeh to produce visually captivating visualizations.
Gain expertise in various types of charts, plots, and graphs.
Craft visually appealing and informative statistical visualizations.
Construct interactive and adaptable plots using Bokeh.
Explore various techniques for conducting Exploratory Data Analysis (EDA).

Who this book is for
This book caters to a wide audience, including undergraduate and postgraduate students, researchers, data managers, and data analysts. It presents an all-encompassing exploration of data visualization, equipping you with the essential groundwork to progress as a data-driven professional.

Table of Contents
1. Understanding Data
2. Data Visualization Importance
3. Data Visualization Use Cases
4. Data Visualization Tools and Techniques
5. Data Visualization with Matplotlib
6. Data Visualization with Seaborn
7. Data Visualization with Bokeh
8. Exploratory Data Analysis

Wybrane bestsellery

BPB Publications - inne książki

Zamknij

Przenieś na półkę
Dodano produkt na półkę
Usunięto produkt z półki
Przeniesiono produkt do archiwum
Przeniesiono produkt do biblioteki

Zamknij

Wybierz metodę płatności

Ebook
80,91 zł
Dodaj do koszyka
Sposób płatności
Zabrania się wykorzystania treści strony do celów eksploracji tekstu i danych (TDM), w tym eksploracji w celu szkolenia technologii AI i innych systemów uczenia maszynowego. It is forbidden to use the content of the site for text and data mining (TDM), including mining for training AI technologies and other machine learning systems.