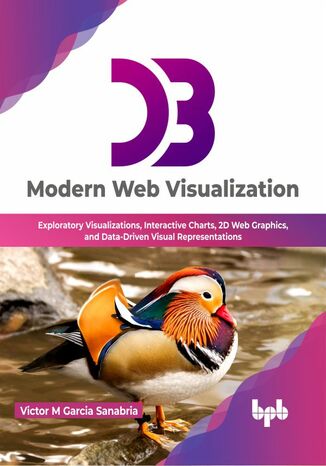
D3: Modern Web Visualization Victor M Garcia Sanabria
- Autor:
- Victor M Garcia Sanabria
- Wydawnictwo:
- BPB Publications
- Ocena:
- Stron:
- 454
- Dostępne formaty:
-
ePubMobi
Zostało Ci
na świąteczne zamówienie
opcje wysyłki »
Opis
książki
:
D3: Modern Web Visualization
How to Make Web Visualizations with D3js
Key Features
Includes narrative tools to master data visualization methods, charts, templates, and D3.
Essential strategies for creating intelligent visualizations and modern graphs beyond simple lines, bars, and pie charts.
Provides the opportunity for readers to create the graphs that are best suited for their data. Description
Picking the most appropriate tool is essential whenever you develop a dynamic chart online. D3.js is a clear winner here. The author of this book set out to delve deeply into the software engineering community's most widely used charting library.
From data requests to scale and style, and even some experiment charts, you'll have a firm grasp on everything you need to know to create your charts. You can make static charts much more engaging by incorporating elements such as tooltips, interactions, legends, and selectors.
The book explains how to make a simple chart in easy-to-understand steps. Each chapter in the book will deepen your understanding of the different components of charts and the options that D3.js provides for making them. The book dives deeply into the code and examines various charting examples for different use cases. This book will help you learn to create charts by constantly referencing all chapters. What you will learn
Create 2D illustrations utilizing SVG, Canvas, and HTML5.
Try out all the different visualization and interaction methods that D3 offers.
Explore color, contour, noise, and texture.
Investigate D3's data-driven methods and DOM manipulation capabilities.
Get access to the full capabilities of modern browsers for producing optimal graphical user interfaces. Who this book is for
This book has been meticulously assembled for readers who work with data visualization, such as UI designers, web developers, makers of BI dashboards, and data analysts. It will teach you how to create the most engaging infographics from messy and stacked information. Table of Contents
1. Getting Started
2. The SVG Tag
3. Treating Data
4. Working with Selections
5. Styling, Templates and Color Theory
6. Scales and Axes
7. Dynamic and Interactive
8. Choosing the right visualization
9. Comparison Charts
10. Distribution Charts
11. Correlation Charts
12. Composition Charts
Dzięki opcji "Druk na żądanie" do sprzedaży wracają tytuły Grupy Helion, które cieszyły sie dużym zainteresowaniem, a których nakład został wyprzedany.
Dla naszych Czytelników wydrukowaliśmy dodatkową pulę egzemplarzy w technice druku cyfrowego.
Co powinieneś wiedzieć o usłudze "Druk na żądanie":
- usługa obejmuje tylko widoczną poniżej listę tytułów, którą na bieżąco aktualizujemy;
- cena książki może być wyższa od początkowej ceny detalicznej, co jest spowodowane kosztami druku cyfrowego (wyższymi niż koszty tradycyjnego druku offsetowego). Obowiązująca cena jest zawsze podawana na stronie WWW książki;
- zawartość książki wraz z dodatkami (płyta CD, DVD) odpowiada jej pierwotnemu wydaniu i jest w pełni komplementarna;
- usługa nie obejmuje książek w kolorze.
Masz pytanie o konkretny tytuł? Napisz do nas: sklep@ebookpoint.pl
Proszę wybrać ocenę!
Proszę wpisać opinię!
Książka drukowana
Oceny i opinie klientów: D3: Modern Web Visualization Victor M Garcia Sanabria (0) Weryfikacja opinii następuje na podstawie historii zamowień na koncie Użytkownika umiejszczającego opinię.