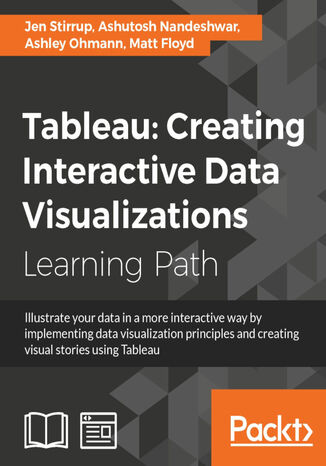
Tableau: Creating Interactive Data Visualizations. Creating Interactive Data Visualizations Matt Floyd, Jen Stirrup, Ashley Ohmann, Ashutosh Nandeshwar

- Autorzy:
- Matt Floyd, Jen Stirrup, Ashley Ohmann, Ashutosh Nandeshwar
- Wydawnictwo:
- Packt Publishing
- Ocena:
- Dostępne formaty:
-
PDFePubMobi
Opis
książki
:
Tableau: Creating Interactive Data Visualizations. Creating Interactive Data Visualizations
This course starts with making you familiar with its features and enable you to develop and enhance your dashboard skills, starting with an overview of what dashboard is, followed by how you can collect data using various mathematical formulas. Next, you'll learn to filter and group data, as well as how to use various functions to present the data in an appealing and accurate way.
In the first module, you will learn how to use the key advanced string functions to play with data and images. You will be walked through the various features of Tableau including dual axes, scatterplot matrices, heat maps, and sizing.In the second module, you’ll start with getting your data into Tableau, move onto generating progressively complex graphics, and end with the finishing touches and packaging your work for distribution. This module is filled with practical examples to help you create filled maps, use custom markers, add slider selectors, and create dashboards. You will learn how to manipulate data in various ways by applying various filters, logic, and calculating various aggregate measures. Finally, in the third module, you learn about Tableau Public using which allows readers to explore data associations in multiple-sourced public data, and uses state-of-the-art dashboard and chart graphics to immerse the users in an interactive experience. In this module, the readers can quickly gain confidence in understanding and expanding their visualization, creation knowledge, and quickly create interesting, interactive data visualizations to bring a richness and vibrancy to complex articles.
The course provides a great overview for beginner to intermediate Tableau users, and covers the creation of data visualizations of varying complexities.
Wybrane bestsellery
Matt Floyd, Jen Stirrup, Ashley Ohmann, Ashutosh Nandeshwar - pozostałe książki
Packt Publishing - inne książki
Dzięki opcji "Druk na żądanie" do sprzedaży wracają tytuły Grupy Helion, które cieszyły sie dużym zainteresowaniem, a których nakład został wyprzedany.
Dla naszych Czytelników wydrukowaliśmy dodatkową pulę egzemplarzy w technice druku cyfrowego.
Co powinieneś wiedzieć o usłudze "Druk na żądanie":
- usługa obejmuje tylko widoczną poniżej listę tytułów, którą na bieżąco aktualizujemy;
- cena książki może być wyższa od początkowej ceny detalicznej, co jest spowodowane kosztami druku cyfrowego (wyższymi niż koszty tradycyjnego druku offsetowego). Obowiązująca cena jest zawsze podawana na stronie WWW książki;
- zawartość książki wraz z dodatkami (płyta CD, DVD) odpowiada jej pierwotnemu wydaniu i jest w pełni komplementarna;
- usługa nie obejmuje książek w kolorze.
Masz pytanie o konkretny tytuł? Napisz do nas: sklep@ebookpoint.pl
Książka drukowana





















Oceny i opinie klientów: Tableau: Creating Interactive Data Visualizations. Creating Interactive Data Visualizations Matt Floyd, Jen Stirrup, Ashley Ohmann, Ashutosh Nandeshwar
(0)