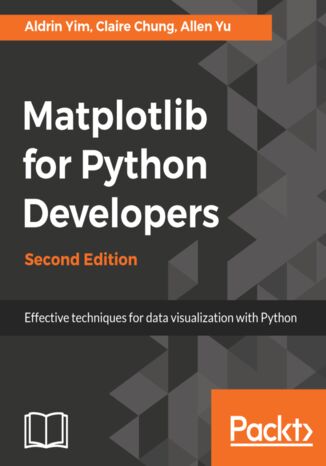
Matplotlib for Python Developers. Effective techniques for data visualization with Python - Second Edition Aldrin Yim, Claire Chung, Allen Yu

- Autorzy:
- Aldrin Yim, Claire Chung, Allen Yu
- Wydawnictwo:
- Packt Publishing
- Ocena:
- Stron:
- 300
- Dostępne formaty:
-
PDFePubMobi
Opis
książki
:
Matplotlib for Python Developers. Effective techniques for data visualization with Python - Second Edition
Matplotlib for Python Developers, Second Edition shows you how to create attractive graphs, charts, and plots using Matplotlib. You will also get a quick introduction to third-party packages, Seaborn, Pandas, Basemap, and Geopandas, and learn how to use them with Matplotlib. After that, you’ll embed and customize your plots in third-party tools such as GTK+3, Qt 5, and wxWidgets. You’ll also be able to tweak the look and feel of your visualization with the help of practical examples provided in this book. Further on, you’ll explore Matplotlib 2.1.x on the web, from a cloud-based platform using third-party packages such as Django. Finally, you will integrate interactive, real-time visualization techniques into your current workflow with the help of practical real-world examples.
By the end of this book, you’ll be thoroughly comfortable with using the popular Python data visualization library Matplotlib 2.1.x and leveraging its power to build attractive, insightful, and powerful visualizations.
Wybrane bestsellery
Packt Publishing - inne książki
Dzięki opcji "Druk na żądanie" do sprzedaży wracają tytuły Grupy Helion, które cieszyły sie dużym zainteresowaniem, a których nakład został wyprzedany.
Dla naszych Czytelników wydrukowaliśmy dodatkową pulę egzemplarzy w technice druku cyfrowego.
Co powinieneś wiedzieć o usłudze "Druk na żądanie":
- usługa obejmuje tylko widoczną poniżej listę tytułów, którą na bieżąco aktualizujemy;
- cena książki może być wyższa od początkowej ceny detalicznej, co jest spowodowane kosztami druku cyfrowego (wyższymi niż koszty tradycyjnego druku offsetowego). Obowiązująca cena jest zawsze podawana na stronie WWW książki;
- zawartość książki wraz z dodatkami (płyta CD, DVD) odpowiada jej pierwotnemu wydaniu i jest w pełni komplementarna;
- usługa nie obejmuje książek w kolorze.
Masz pytanie o konkretny tytuł? Napisz do nas: sklep@ebookpoint.pl
Książka drukowana













Oceny i opinie klientów: Matplotlib for Python Developers. Effective techniques for data visualization with Python - Second Edition Aldrin Yim, Claire Chung, Allen Yu
(0)