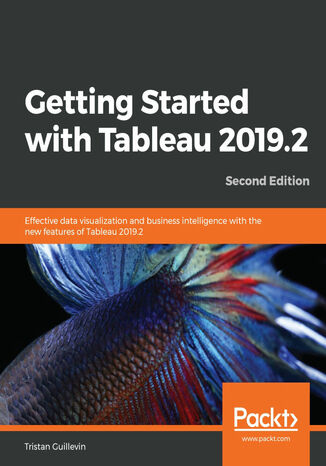
Getting Started with Tableau 2019.2. Effective data visualization and business intelligence with the new features of Tableau 2019.2 - Second Edition Tristan Guillevin

- Autor:
- Tristan Guillevin
- Wydawnictwo:
- Packt Publishing
- Ocena:
- Stron:
- 260
- Dostępne formaty:
-
PDFePubMobi
Opis
książki
:
Getting Started with Tableau 2019.2. Effective data visualization and business intelligence with the new features of Tableau 2019.2 - Second Edition
The book starts by highlighting the new functionalities of Tableau 2019.2, providing concrete examples of how to use them. However, if you're new to Tableau, you won't have to worry as the book also covers the major aspects of Tableau with relevant examples. You'll learn how to connect to data, build a data source, visualize your data, build a dashboard, and even share data online. In the concluding chapters, you'll delve into advanced techniques such as creating a cross-database join and data blending.
By the end of this book, you will be able to use Tableau effectively to create quick, cost-effective, and business-efficient Business Intelligence (BI) solutions.
Wybrane bestsellery
Packt Publishing - inne książki
Dzięki opcji "Druk na żądanie" do sprzedaży wracają tytuły Grupy Helion, które cieszyły sie dużym zainteresowaniem, a których nakład został wyprzedany.
Dla naszych Czytelników wydrukowaliśmy dodatkową pulę egzemplarzy w technice druku cyfrowego.
Co powinieneś wiedzieć o usłudze "Druk na żądanie":
- usługa obejmuje tylko widoczną poniżej listę tytułów, którą na bieżąco aktualizujemy;
- cena książki może być wyższa od początkowej ceny detalicznej, co jest spowodowane kosztami druku cyfrowego (wyższymi niż koszty tradycyjnego druku offsetowego). Obowiązująca cena jest zawsze podawana na stronie WWW książki;
- zawartość książki wraz z dodatkami (płyta CD, DVD) odpowiada jej pierwotnemu wydaniu i jest w pełni komplementarna;
- usługa nie obejmuje książek w kolorze.
Masz pytanie o konkretny tytuł? Napisz do nas: sklep@ebookpoint.pl
Książka drukowana


















Oceny i opinie klientów: Getting Started with Tableau 2019.2. Effective data visualization and business intelligence with the new features of Tableau 2019.2 - Second Edition Tristan Guillevin
(0)