
D3.js Quick Start Guide. Create amazing, interactive visualizations in the browser with JavaScript Matthew Huntington

- Autor:
- Matthew Huntington
- Wydawnictwo:
- Packt Publishing
- Ocena:
- Stron:
- 180
- Dostępne formaty:
-
PDFePubMobi
Opis
książki
:
D3.js Quick Start Guide. Create amazing, interactive visualizations in the browser with JavaScript
The book begins with an overview of SVG, the basis for creating two-dimensional graphics in the browser. Once the reader has a firm understanding of SVG, we will tackle the basics of how to use D3.js to connect data to our SVG elements. We will start with a scatter plot that maps run data to circles on a graph, and expand our scatter plot to make it interactive. You will see how you can easily allow the users of your graph to create, edit, and delete run data by simply dragging and clicking the graph. Next, we will explore creating a bar graph, using external data from a mock API.
After that, we will explore animations and motion with a bar graph, and use various physics-based forces to create a force-directed graph. Finally, we will look at how to use GeoJSON data to create a map.
Wybrane bestsellery
-
 Ta książka to kompleksowy przewodnik po umiejętnościach twardych i miękkich niezbędnych do odniesienia sukcesu w tej dynamicznie rozwijającej się dziedzinie. Autorka dzieli się wiedzą zdobytą podczas ponad dziesięcioletniej kariery, pokazując, jak radzić sobie z rzeczywistymi wyzwaniami analitycznymi. Zamiast skupiać się wyłącznie na narzędziach i wzorach, opisuje praktyczne aspekty codziennej pracy analityka. Obejmuje przy tym cały proces: od definiowania pytań i metryk, przez dobór metod statystycznych, aż po skuteczną komunikację z interesariuszami. Omawia również zagadnienia związane z modelowaniem statystycznym, wykorzystaniem zewnętrznych źródeł danych, a także nowoczesnymi narzędziami analitycznymi, w tym zastosowaniem sztucznej inteligencji.
-
ebook
-
książka
65 pkt
(59,50 zł najniższa cena z 30 dni)
65.45 zł
119.00 zł (-45%) -
-
 Data is at the center of many challenges in system design today. Difficult issues such as scalability, consistency, reliability, efficiency, and maintainability need to be resolved. In addition, there's an overwhelming variety of systems, including relational databases, NoSQL datastores, data warehouses, and data lakes. There are cloud services, on
-

-
ebook
203 pkt
(194,65 zł najniższa cena z 30 dni)
203.15 zł
239.00 zł (-15%) -
-
 Zdolność do gromadzenia, przetwarzania i korzystania z posiadanych danych stanowi podstawę gospodarki bazującej na informacji. W ciągu ostatnich lat dane zdobyły status nowego bezcennego kruszcu kto ma do nich dostęp i potrafi ich efektywnie używać, ten zyskuje ogromną przewagę konkurencyjną. Nic w tym dziwnego, że specjaliści, którzy potrafią projektować, budować i utrzymywać infrastrukturę danych (tacy jak data engineer), zyskują na znaczeniu i są poszukiwani na rynku. Bez ich szczególnych umiejętności niemożliwe byłoby zarządzanie firmą w nowoczesnym duchu.
-
kurs
104 pkt
(104,25 zł najniższa cena z 30 dni)
104.25 zł
139.00 zł (-25%) -
-
 Niniejszy kurs ma za zadanie przybliżyć jego uczestnikowi temat hurtowni danych. Pod tym pojęciem kryje się szczególny rodzaj systemu zarządzania danymi, który umożliwia i wspiera działania z zakresu analizy biznesowej przede wszystkim analityki. Ze względu na specyficzne przeznaczenie, w hurtowniach danych znajduje się zwykle wiele danych historycznych, do tego pochodzących z rozmaitych źródeł. Tego typu systemy zarządzania danymi są niezwykle cenne dla przedsiębiorstw. Dzięki nim możliwe jest analizowania dużych ilości danych wariantowych, a co za tym idzie wyciąganie z nich cennych wniosków. Dodatkową rolą takiej hurtowni jest bycie archiwum danych.
-
kurs
89 pkt
(89,25 zł najniższa cena z 30 dni)
89.25 zł
119.00 zł (-25%) -
-
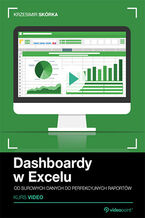 Analityka danych to umiejętność biznesowa, której fundamentem jest Excel. Dzięki biegłej znajomości tego narzędzia nie tylko usprawnisz raportowanie i automatyzację monotonnych zadań, ale także swobodnie przejdziesz do nauki bardziej zaawansowanych narzędzi analitycznych, takich jak Power BI czy SQL. Wiele osób korzysta z Excela na co dzień, ale nie zdaje sobie sprawy, jaki potencjał w nim drzemie. To nie jest tylko arkusz kalkulacyjny – to potężny mechanizm, który pozwala na tworzenie dynamicznych dashboardów, ułatwiających analizę kluczowych wskaźników sprzedażowych, finansowych i kadrowych. Tworzenie takich dashboardów nie wymaga skomplikowanej wiedzy programistycznej, a efekty, jakie osiągniesz, mogą być naprawdę imponujące. Z naszym szkoleniem odkryjesz ukryte funkcje Excela – od tabel przestawnych, przez fragmentatory, po dynamiczne wykresy i inteligentne formuły, za sprawą których będziesz wizualizować dane w sposób czytelny i atrakcyjny. Automatyzacja procesów za pomocą Excela pozwoli Ci zaoszczędzić godziny pracy, wyeliminuje bowiem powtarzalne zadania i poprawi organizację danych. Bez względu na to, czy pracujesz w księgowości, dziale HR, czy zajmujesz się zarządzaniem projektami, umiejętność przejrzystego prezentowania danych znacząco wpłynie na Twoje decyzje biznesowe. Pracodawcy poszukują specjalistów, którzy potrafią analizować liczby i prezentować je w czytelnej formie. Wyróżnij się na rynku i zdobądź wymarzony awans! Twórz dashboardy jak prawdziwy profesjonalista, zamieniając surowe dane w przejrzyste i dynamiczne wizualizacje.
-
kurs
96 pkt
(96,75 zł najniższa cena z 30 dni)
96.75 zł
129.00 zł (-25%) -
-
 Język DAX (Data Analysis Expressions) został stworzony przez firmę Microsoft jako język wyrażeń, służący do pracy z takimi narzędziami analizy danych jak Power BI, Power Pivot w Excelu czy SQL Server Analysis Services. Pozwala tworzyć zaawansowane raporty, analizy biznesowe i dynamiczne wizualizacje danych. Jeśli zamierzasz na poważnie zająć się analizą danych, warto nauczyć się korzystać z języka DAX. Ten kurs pokaże Ci, jakie możliwości oferuje on w tandemie z Power BI – zestawem aplikacji i usług klasy business intelligence od Microsoft, służącym gromadzeniu, zarządzaniu, przetwarzaniu i analizie danych pochodzących z różnych źródeł. Power BI uznaje się aktualnie za najpopularniejsze narzędzie w obszarze business intelligence na rynku.
-
kurs
171 pkt
(171,74 zł najniższa cena z 30 dni)
171.74 zł
229.00 zł (-25%) -
-
 Stanowiący część Microsoft Power Platform zestaw narzędzi Power BI służy przede wszystkim wizualizacji danych i raportowaniu. Ze względu na intuicyjny interfejs i duże możliwości narzędzia te są coraz częściej zaprzęgane do pracy w firmach na całym świecie, w rozmaitych branżach – od finansów, przez marketing, aż po zarządzanie zasobami ludzkimi. Szkoląc się z naszym kursem, poznasz to rozwiązanie od strony praktycznej i zdobędziesz umiejętności gotowe do zastosowania w Twojej codziennej pracy. W ramach nauki opanujesz nie tylko podstawy Power BI, ale też najbardziej zaawansowane funkcje, które oferuje to oprogramowanie, ponieważ będziemy działać na realnych przykładach, z życia wziętych – takich, na które będziesz natrafiać codziennie w swojej praktyce biznesowej.
-
kurs
149 pkt
(149,25 zł najniższa cena z 30 dni)
149.25 zł
199.00 zł (-25%) -
-
 Biznes nie istnieje bez twardych danych, założeń, KPI i ich realizacji. Także ta jego część, która jest związana z promocją. Szczególnie online. Dziś nie można być marketerem z prawdziwego zdarzenia i nie znać chociażby narzędzi oferowanych przez Google ― Analytics, Tag Manager, Search Console i Trends. Te nazwy kojarzą Ci się z czymś niezrozumiałym albo budzą obawy? Nie martw się i sięgnij po tę książkę! Dowiesz się z niej, jak efektywnie korzystać z internetowych rozwiązań analitycznych.
-
ebook
-
książka
31 pkt
(28,50 zł najniższa cena z 30 dni)
31.35 zł
57.00 zł (-45%) -
-
 Współczesny biznes liczbami stoi. Wykresy, tabele, przetwarzanie danych, analizowanie wyników z przeszłości, prognozowanie sprzedaży, zakupów i produkcji… Większość działów w dużych przedsiębiorstwach wspiera się tym, co policzalne. Większość, ale raczej nie dział human resources. Dlaczego? Czyżby HR-owcy nie wierzyli w liczby i stawiali na intuicję? Może. A może po prostu brakuje im rzetelnych narzędzi, dzięki którym można przeanalizować dane, jakie są dostępne dla osób wyspecjalizowanych w zarządzaniu zasobami ludzkimi firmy?
-
ebook
-
książka
43 pkt
(39,50 zł najniższa cena z 30 dni)
43.45 zł
79.00 zł (-45%) -
-
 Proponowany przez nas kurs jest przeznaczony dla osób, które mają już za sobą pierwsze kroki w obsłudze Power BI Desktop, stworzyły raporty i chciałyby odkryć, jak wygląda realna praca z serwisem Power BI i współdzielenie raportów w środowisku dużej albo średniej firmy. Jeśli chcesz poznać cały proces, od pobrania i przygotowania danych aż po dystrybucję raportów do odpowiednich odbiorców, w sposób symulujący codzienne zmagania Power BI developera - jesteś we właściwym miejscu.
-
kurs
374 pkt
(374,25 zł najniższa cena z 30 dni)
374.25 zł
499.00 zł (-25%) -


Szczegóły książki
- Tytuł oryginału:
- D3.js Quick Start Guide. Create amazing, interactive visualizations in the browser with JavaScript
- ISBN Ebooka:
- 978-17-893-4774-6, 9781789347746
- Data wydania ebooka :
-
2018-09-27
 Data wydania ebooka często jest dniem wprowadzenia tytułu do sprzedaży i może nie być równoznaczna
z datą wydania książki papierowej. Dodatkowe informacje możesz znaleźć w darmowym fragmencie.
Jeśli masz wątpliwości skontaktuj się z nami sklep@ebookpoint.pl.
Data wydania ebooka często jest dniem wprowadzenia tytułu do sprzedaży i może nie być równoznaczna
z datą wydania książki papierowej. Dodatkowe informacje możesz znaleźć w darmowym fragmencie.
Jeśli masz wątpliwości skontaktuj się z nami sklep@ebookpoint.pl.
- Język publikacji:
- angielski
- Rozmiar pliku Pdf:
- 9.8MB
- Rozmiar pliku ePub:
- 9.2MB
- Rozmiar pliku Mobi:
- 25.4MB

Dzięki opcji "Druk na żądanie" do sprzedaży wracają tytuły Grupy Helion, które cieszyły sie dużym zainteresowaniem, a których nakład został wyprzedany.
Dla naszych Czytelników wydrukowaliśmy dodatkową pulę egzemplarzy w technice druku cyfrowego.
Co powinieneś wiedzieć o usłudze "Druk na żądanie":
- usługa obejmuje tylko widoczną poniżej listę tytułów, którą na bieżąco aktualizujemy;
- cena książki może być wyższa od początkowej ceny detalicznej, co jest spowodowane kosztami druku cyfrowego (wyższymi niż koszty tradycyjnego druku offsetowego). Obowiązująca cena jest zawsze podawana na stronie WWW książki;
- zawartość książki wraz z dodatkami (płyta CD, DVD) odpowiada jej pierwotnemu wydaniu i jest w pełni komplementarna;
- usługa nie obejmuje książek w kolorze.
Masz pytanie o konkretny tytuł? Napisz do nas: sklep@ebookpoint.pl
Książka drukowana

Oceny i opinie klientów: D3.js Quick Start Guide. Create amazing, interactive visualizations in the browser with JavaScript Matthew Huntington
(0)