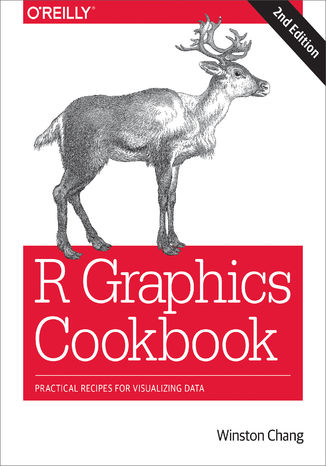
R Graphics Cookbook. Practical Recipes for Visualizing Data. 2nd Edition
- Autor:
- Winston Chang


- Ocena:
- Bądź pierwszym, który oceni tę książkę
- Stron:
- 444
- Dostępne formaty:
-
ePubMobi
Opis ebooka: R Graphics Cookbook. Practical Recipes for Visualizing Data. 2nd Edition
This O’Reilly cookbook provides more than 150 recipes to help scientists, engineers, programmers, and data analysts generate high-quality graphs quickly—without having to comb through all the details of R’s graphing systems. Each recipe tackles a specific problem with a solution you can apply to your own project and includes a discussion of how and why the recipe works.
Most of the recipes in this second edition use the updated version of the ggplot2 package, a powerful and flexible way to make graphs in R. You’ll also find expanded content about the visual design of graphics. If you have at least a basic understanding of the R language, you’re ready to get started with this easy-to-use reference.
- Use R’s default graphics for quick exploration of data
- Create a variety of bar graphs, line graphs, and scatter plots
- Summarize data distributions with histograms, density curves, box plots, and more
- Provide annotations to help viewers interpret data
- Control the overall appearance of graphics
- Explore options for using colors in plots
- Create network graphs, heat maps, and 3D scatter plots
- Get your data into shape using packages from the tidyverse
Wybrane bestsellery
-
 This practical guide provides more than 150 recipes to help you generate high-quality graphs quickly, without having to comb through all the details of R’s graphing systems. Each recipe tackles a specific problem with a solution you can apply to your own project, and includes a discussion o...
R Graphics Cookbook. Practical Recipes for Visualizing Data R Graphics Cookbook. Practical Recipes for Visualizing Data
(118.15 zł najniższa cena z 30 dni)118.15 zł
139.00 zł(-15%) -
 Mastering Data transformation is essential for enhancing their data models and business intelligence. The Definitive Guide to Power Query equips you with the knowledge and skills to master the tool while leveraging its remarkable capabilities.
The Definitive Guide to Power Query (M). Mastering complex data transformation with Power Query The Definitive Guide to Power Query (M). Mastering complex data transformation with Power Query
Gregory Deckler, Rick de Groot, Melissa de Korte, Brian Julius
-
 Jeśli w swojej pracy masz lub miewasz do czynienia z danymi, z pewnością orientujesz się, że do tego celu stworzono dotąd całkiem sporo narzędzi. Nic dziwnego – przy tej liczbie danych, z jaką spotykamy się w dzisiejszym cyfrowym świecie, zdolność do ich sprawnego analizowania i wyciągania ...
Grafana. Kurs video. Monitorowanie, analiza i wizualizacja danych w czasie rzeczywistym Grafana. Kurs video. Monitorowanie, analiza i wizualizacja danych w czasie rzeczywistym
(39.90 zł najniższa cena z 30 dni)69.50 zł
139.00 zł(-50%) -
 Dzisiejszą gospodarką rządzi informacja. Kto potrafi ją wyłuskać z zalewu danych, ten zyskuje konkurencyjną przewagę. Świadomi tego twórcy oprogramowania komputerowego stworzyli szereg narzędzi służących wyszukiwaniu informacji, ich przetwarzaniu, analizowaniu i prezentowaniu w sposób dostępny dl...
Elasticsearch. Kurs video. Pozyskiwanie i analiza danych Elasticsearch. Kurs video. Pozyskiwanie i analiza danych
(99.59 zł najniższa cena z 30 dni)112.05 zł
249.00 zł(-55%) -
 Power Apps to platforma stworzona przez Microsoft, umożliwiająca łatwe projektowanie, tworzenie i dostosowywanie aplikacji bez konieczności posiadania głębokiej wiedzy programistycznej. Z użyciem Power Apps można budować niestandardowe aplikacje, które efektywnie wspierają i automatyzują różne pr...
Power Apps. Kurs video. Tworzenie biznesowych aplikacji no-code Power Apps. Kurs video. Tworzenie biznesowych aplikacji no-code
(69.65 zł najniższa cena z 30 dni)99.49 zł
199.00 zł(-50%) -
 Tę książkę docenią wszyscy zainteresowani eksploracją danych i uczeniem maszynowym, którzy chcieliby pewnie poruszać się w świecie nauki o danych. Pokazano tu, w jaki sposób Excel pozwala zobrazować proces ich eksplorowania i jak działają poszczególne techniki w tym zakresie. Przejrzyście wyjaśni...
Eksploracja danych za pomocą Excela. Metody uczenia maszynowego krok po kroku Eksploracja danych za pomocą Excela. Metody uczenia maszynowego krok po kroku
(43.55 zł najniższa cena z 30 dni)46.90 zł
67.00 zł(-30%) -
 Oto zwięzłe i równocześnie praktyczne kompendium, w którym znajdziesz 20 praktyk udanego planowania, analizy, specyfikacji, walidacji i zarządzania wymaganiami. Praktyki te są odpowiednie dla projektów zarządzanych zarówno w tradycyjny, jak i zwinny sposób, niezależnie od branży. Sprawią, że zesp...
Specyfikacja wymagań oprogramowania. Kluczowe praktyki analizy biznesowej Specyfikacja wymagań oprogramowania. Kluczowe praktyki analizy biznesowej
(46.90 zł najniższa cena z 30 dni)46.90 zł
67.00 zł(-30%) -
 W dzisiejszej praktyce biznesowej duże znaczenie mają dane i ich analiza. W analizie zastosowanie znajduje wiele modeli statystycznych, implementowanych w różnych programach komputerowych. Na przykład Excel ma specjalny dodatek, nazwany po prostu Analiza Danych. Bardzo popularne narzędzie stanowi...
R i pakiet shiny. Kurs video. Interaktywne aplikacje w analizie danych R i pakiet shiny. Kurs video. Interaktywne aplikacje w analizie danych
(67.05 zł najniższa cena z 30 dni)67.05 zł
149.00 zł(-55%) -
 Oto drugie, zaktualizowane i uzupełnione wydanie przewodnika po bibliotece Pandas. Dzięki tej przystępnej książce nauczysz się w pełni korzystać z możliwości oferowanych przez bibliotekę, nawet jeśli dopiero zaczynasz przygodę z analizą danych w Pythonie. Naukę rozpoczniesz z użyciem rzeczywisteg...
Jak analizować dane z biblioteką Pandas. Praktyczne wprowadzenie. Wydanie II Jak analizować dane z biblioteką Pandas. Praktyczne wprowadzenie. Wydanie II
(70.85 zł najniższa cena z 30 dni)76.30 zł
109.00 zł(-30%) -
 Czy zastanawiasz się czasem nad tym, jak to możliwe, że jesteśmy w stanie „rozmawiać” z maszynami? Że coś mówimy, a one nas rozumieją i odpowiadają na nasze pytania, realizują polecenia, wykonują zadania? I na odwrót – to one mówią (i piszą) do nas słowami, które są dla nas jasn...
NLP. Kurs video. Analiza danych tekstowych w języku Python NLP. Kurs video. Analiza danych tekstowych w języku Python
(52.15 zł najniższa cena z 30 dni)96.85 zł
149.00 zł(-35%)
Ebooka "R Graphics Cookbook. Practical Recipes for Visualizing Data. 2nd Edition" przeczytasz na:
-
czytnikach Inkbook, Kindle, Pocketbook, Onyx Boox i innych
-
systemach Windows, MacOS i innych
-
systemach Windows, Android, iOS, HarmonyOS
-
na dowolnych urządzeniach i aplikacjach obsługujących formaty: PDF, EPub, Mobi
Masz pytania? Zajrzyj do zakładki Pomoc »
Audiobooka "R Graphics Cookbook. Practical Recipes for Visualizing Data. 2nd Edition" posłuchasz:
-
w aplikacji Ebookpoint na Android, iOS, HarmonyOs
-
na systemach Windows, MacOS i innych
-
na dowolnych urządzeniach i aplikacjach obsługujących format MP3 (pliki spakowane w ZIP)
Masz pytania? Zajrzyj do zakładki Pomoc »
Kurs Video "R Graphics Cookbook. Practical Recipes for Visualizing Data. 2nd Edition" zobaczysz:
-
w aplikacjach Ebookpoint i Videopoint na Android, iOS, HarmonyOs
-
na systemach Windows, MacOS i innych z dostępem do najnowszej wersji Twojej przeglądarki internetowej
Szczegóły ebooka
- ISBN Ebooka:
- 978-14-919-7855-9, 9781491978559
- Data wydania ebooka:
-
2018-10-25
 Data wydania ebooka często jest dniem wprowadzenia tytułu do sprzedaży i może nie być równoznaczna
z datą wydania książki papierowej. Dodatkowe informacje możesz znaleźć w darmowym fragmencie.
Jeśli masz wątpliwości skontaktuj się z nami sklep@ebookpoint.pl.
- Język publikacji:
- angielski
- Rozmiar pliku ePub:
- 17.4MB
- Rozmiar pliku Mobi:
- 29.8MB
Spis treści ebooka
- Preface
- Recipes
- Software and Platform Notes
- Conventions Used in This Book
- OReilly Safari
- How to Contact Us
- Acknowledgments
- 1. R Basics
- 1.1. Installing a Package
- 1.2. Loading a Package
- 1.3. Upgrading Packages
- 1.4. Loading a Delimited Text Data File
- 1.5. Loading Data from an Excel File
- 1.6. Loading Data from SPSS/SAS/Stata Files
- 1.7. Chaining Functions Together with %>%, the Pipe Operator
- 2. Quickly Exploring Data
- 2.1. Creating a Scatter Plot
- 2.2. Creating a Line Graph
- 2.3. Creating a Bar Graph
- 2.4. Creating a Histogram
- 2.5. Creating a Box Plot
- 2.6. Plotting a Function Curve
- 3. Bar Graphs
- 3.1. Making a Basic Bar Graph
- 3.2. Grouping Bars Together
- 3.3. Making a Bar Graph of Counts
- 3.4. Using Colors in a Bar Graph
- 3.5. Coloring Negative and Positive Bars Differently
- 3.6. Adjusting Bar Width and Spacing
- 3.7. Making a Stacked Bar Graph
- 3.8. Making a Proportional Stacked Bar Graph
- 3.9. Adding Labels to a Bar Graph
- 3.10. Making a Cleveland Dot Plot
- 4. Line Graphs
- 4.1. Making a Basic Line Graph
- 4.2. Adding Points to a Line Graph
- 4.3. Making a Line Graph with Multiple Lines
- 4.4. Changing the Appearance of Lines
- 4.5. Changing the Appearance of Points
- 4.6. Making a Graph with a Shaded Area
- 4.7. Making a Stacked Area Graph
- 4.8. Making a Proportional Stacked Area Graph
- 4.9. Adding a Confidence Region
- 5. Scatter Plots
- 5.1. Making a Basic Scatter Plot
- 5.2. Grouping Points Together Using Shapes or Colors
- 5.3. Using Different Point Shapes
- 5.4. Mapping a Continuous Variable to Color or Size
- 5.5. Dealing with Overplotting
- 5.6. Adding Fitted Regression Model Lines
- 5.7. Adding Fitted Lines from an Existing Model
- 5.8. Adding Fitted Lines from Multiple Existing Models
- 5.9. Adding Annotations with Model Coefficients
- 5.10. Adding Marginal Rugs to a Scatter Plot
- 5.11. Labeling Points in a Scatter Plot
- 5.12. Creating a Balloon Plot
- 5.13. Making a Scatter Plot Matrix
- 6. Summarized Data Distributions
- 6.1. Making a Basic Histogram
- 6.2. Making Multiple Histograms from Grouped Data
- 6.3. Making a Density Curve
- 6.4. Making Multiple Density Curves from Grouped Data
- 6.5. Making a Frequency Polygon
- 6.6. Making a Basic Box Plot
- 6.7. Adding Notches to a Box Plot
- 6.8. Adding Means to a Box Plot
- 6.9. Making a Violin Plot
- 6.10. Making a Dot Plot
- 6.11. Making Multiple Dot Plots for Grouped Data
- 6.12. Making a Density Plot of Two-Dimensional Data
- 7. Annotations
- 7.1. Adding Text Annotations
- 7.2. Using Mathematical Expressions in Annotations
- 7.3. Adding Lines
- 7.4. Adding Line Segments and Arrows
- 7.5. Adding a Shaded Rectangle
- 7.6. Highlighting an Item
- 7.7. Adding Error Bars
- 7.8. Adding Annotations to Individual Facets
- 8. Axes
- 8.1. Swapping X- and Y-Axes
- 8.2. Setting the Range of a Continuous Axis
- 8.3. Reversing a Continuous Axis
- 8.4. Changing the Order of Items on a Categorical Axis
- 8.5. Setting the Scaling Ratio of the X- and Y-Axes
- 8.6. Setting the Positions of Tick Marks
- 8.7. Removing Tick Marks and Labels
- 8.8. Changing the Text of Tick Labels
- 8.9. Changing the Appearance of Tick Labels
- 8.10. Changing the Text of Axis Labels
- 8.11. Removing Axis Labels
- 8.12. Changing the Appearance of Axis Labels
- 8.13. Showing Lines Along the Axes
- 8.14. Using a Logarithmic Axis
- 8.15. Adding Ticks for a Logarithmic Axis
- 8.16. Making a Circular Plot
- 8.17. Using Dates on an Axis
- 8.18. Using Relative Times on an Axis
- 9. Controlling the Overall Appearance of Graphs
- 9.1. Setting the Title of a Graph
- 9.2. Changing the Appearance of Text
- 9.3. Using Themes
- 9.4. Changing the Appearance of Theme Elements
- 9.5. Creating Your Own Themes
- 9.6. Hiding Grid Lines
- 10. Legends
- 10.1. Removing the Legend
- 10.2. Changing the Position of a Legend
- 10.3. Changing the Order of Items in a Legend
- 10.4. Reversing the Order of Items in a Legend
- 10.5. Changing a Legend Title
- 10.6. Changing the Appearance of a Legend Title
- 10.7. Removing a Legend Title
- 10.8. Changing the Labels in a Legend
- 10.9. Changing the Appearance of Legend Labels
- 10.10. Using Labels with Multiple Lines of Text
- 11. Facets
- 11.1. Splitting Data into Subplots with Facets
- 11.2. Using Facets with Different Axes
- 11.3. Changing the Text of Facet Labels
- 11.4. Changing the Appearance of Facet Labels and Headers
- 12. Using Colors in Plots
- 12.1. Setting the Colors of Objects
- 12.2. Representing Variables with Colors
- 12.3. Using a Colorblind-Friendly Palette
- 12.4. Using a Different Palette for a Discrete Variable
- 12.5. Using a Manually Defined Palette for a Discrete Variable
- 12.6. Using a Manually Defined Palette for a Continuous Variable
- 12.7. Coloring a Shaded Region Based on Value
- 13. Miscellaneous Graphs
- 13.1. Making a Correlation Matrix
- 13.2. Plotting a Function
- 13.3. Shading a Subregion Under a Function Curve
- 13.4. Creating a Network Graph
- 13.5. Using Text Labels in a Network Graph
- 13.6. Creating a Heat Map
- 13.7. Creating a Three-Dimensional Scatter Plot
- 13.8. Adding a Prediction Surface to a Three-Dimensional Plot
- 13.9. Saving a Three-Dimensional Plot
- 13.10. Animating a Three-Dimensional Plot
- 13.11. Creating a Dendrogram
- 13.12. Creating a Vector Field
- 13.13. Creating a QQ Plot
- 13.14. Creating a Graph of an Empirical Cumulative Distribution Function
- 13.15. Creating a Mosaic Plot
- 13.16. Creating a Pie Chart
- 13.17. Creating a Map
- 13.18. Creating a Choropleth Map
- 13.19. Making a Map with a Clean Background
- 13.20. Creating a Map from a Shapefile
- 14. Output for Presentation
- 14.1. Outputting to PDF Vector Files
- 14.2. Outputting to SVG Vector Files
- 14.3. Outputting to WMF Vector Files
- 14.4. Editing a Vector Output File
- 14.5. Outputting to Bitmap (PNG/TIFF) Files
- 14.6. Using Fonts in PDF Files
- 14.7. Using Fonts in Windows Bitmap or Screen Output
- 14.8. Combining Several Plots into the Same Graphic
- 15. Getting Your Data into Shape
- 15.1. Creating a Data Frame
- 15.2. Getting Information About a Data Structure
- 15.3. Adding a Column to a Data Frame
- 15.4. Deleting a Column from a Data Frame
- 15.5. Renaming Columns in a Data Frame
- 15.6. Reordering Columns in a Data Frame
- 15.7. Getting a Subset of a Data Frame
- 15.8. Changing the Order of Factor Levels
- 15.9. Changing the Order of Factor Levels Based on Data Values
- 15.10. Changing the Names of Factor Levels
- 15.11. Removing Unused Levels from a Factor
- 15.12. Changing the Names of Items in a Character Vector
- 15.13. Recoding a Categorical Variable to Another Categorical Variable
- 15.14. Recoding a Continuous Variable to a Categorical Variable
- 15.15. Calculating New Columns from Existing Columns
- 15.16. Calculating New Columns by Groups
- 15.17. Summarizing Data by Groups
- 15.18. Summarizing Data with Standard Errors and Confidence Intervals
- 15.19. Converting Data from Wide to Long
- 15.20. Converting Data from Long to Wide
- 15.21. Converting a Time Series Object to Times and Values
- A. Understanding ggplot2
- Background
- Some Terminology and Theory
- Building a Simple Plot
- Printing
- Stats
- Themes
- End
- Index
O'Reilly Media - inne książki
-
 Software as a service (SaaS) is on the path to becoming the de facto model for building, delivering, and operating software solutions. Adopting a multi-tenant SaaS model requires builders to take on a broad range of new architecture, implementation, and operational challenges. How data is partiti...(237.15 zł najniższa cena z 30 dni)
245.65 zł
289.00 zł(-15%) -
 Great engineers don't necessarily make great leaders—at least, not without a lot of work. Finding your path to becoming a strong leader is often fraught with challenges. It's not easy to figure out how to be strategic, successful, and considerate while also being firm. Whether you're on the...(118.15 zł najniższa cena z 30 dni)
126.65 zł
149.00 zł(-15%) -
 Data science happens in code. The ability to write reproducible, robust, scaleable code is key to a data science project's success—and is absolutely essential for those working with production code. This practical book bridges the gap between data science and software engineering,and clearl...(211.65 zł najniższa cena z 30 dni)
211.65 zł
249.00 zł(-15%) -
 With the massive adoption of microservices, operators and developers face far more complexity in their applications today. Service meshes can help you manage this problem by providing a unified control plane to secure, manage, and monitor your entire network. This practical guide shows you how th...(203.15 zł najniższa cena z 30 dni)
203.15 zł
239.00 zł(-15%) -
 Get practical advice on how to leverage AI development tools for all stages of code creation, including requirements, planning, design, coding, debugging, testing, and documentation. With this book, beginners and experienced developers alike will learn how to use a wide range of tools, from gener...(164.25 zł najniższa cena z 30 dni)
186.15 zł
219.00 zł(-15%) -
 Rust's popularity is growing, due in part to features like memory safety, type safety, and thread safety. But these same elements can also make learning Rust a challenge, even for experienced programmers. This practical guide helps you make the transition to writing idiomatic Rust—while als...(164.25 zł najniższa cena z 30 dni)
186.15 zł
219.00 zł(-15%) -
 Advance your Power BI skills by adding AI to your repertoire at a practice level. With this practical book, business-oriented software engineers and developers will learn the terminologies, practices, and strategy necessary to successfully incorporate AI into your business intelligence estate. Je...(220.15 zł najniższa cena z 30 dni)
211.65 zł
249.00 zł(-15%) -
 Microservices can be a very effective approach for delivering value to your organization and to your customers. If you get them right, microservices help you to move fast by making changes to small parts of your system hundreds of times a day. But if you get them wrong, microservices will just ma...(203.15 zł najniższa cena z 30 dni)
203.15 zł
239.00 zł(-15%) -
 JavaScript gives web developers great power to create rich interactive browser experiences, and much of that power is provided by the browser itself. Modern web APIs enable web-based applications to come to life like never before, supporting actions that once required browser plug-ins. Some are s...(186.15 zł najniższa cena z 30 dni)
186.15 zł
219.00 zł(-15%) -
 How will software development and operations have to change to meet the sustainability and green needs of the planet? And what does that imply for development organizations? In this eye-opening book, sustainable software advocates Anne Currie, Sarah Hsu, and Sara Bergman provide a unique overview...(169.14 zł najniższa cena z 30 dni)
169.14 zł
199.00 zł(-15%)
Dzieki opcji "Druk na żądanie" do sprzedaży wracają tytuły Grupy Helion, które cieszyły sie dużym zainteresowaniem, a których nakład został wyprzedany.
Dla naszych Czytelników wydrukowaliśmy dodatkową pulę egzemplarzy w technice druku cyfrowego.
Co powinieneś wiedzieć o usłudze "Druk na żądanie":
- usługa obejmuje tylko widoczną poniżej listę tytułów, którą na bieżąco aktualizujemy;
- cena książki może być wyższa od początkowej ceny detalicznej, co jest spowodowane kosztami druku cyfrowego (wyższymi niż koszty tradycyjnego druku offsetowego). Obowiązująca cena jest zawsze podawana na stronie WWW książki;
- zawartość książki wraz z dodatkami (płyta CD, DVD) odpowiada jej pierwotnemu wydaniu i jest w pełni komplementarna;
- usługa nie obejmuje książek w kolorze.
Masz pytanie o konkretny tytuł? Napisz do nas: sklep[at]helion.pl.
Książka, którą chcesz zamówić pochodzi z końcówki nakładu. Oznacza to, że mogą się pojawić drobne defekty (otarcia, rysy, zagięcia).
Co powinieneś wiedzieć o usłudze "Końcówka nakładu":
- usługa obejmuje tylko książki oznaczone tagiem "Końcówka nakładu";
- wady o których mowa powyżej nie podlegają reklamacji;
Masz pytanie o konkretny tytuł? Napisz do nas: sklep[at]helion.pl.
Książka drukowana


Oceny i opinie klientów: R Graphics Cookbook. Practical Recipes for Visualizing Data. 2nd Edition Winston Chang (0) Weryfikacja opinii następuję na podstawie historii zamówień na koncie Użytkownika umieszczającego opinię. Użytkownik mógł otrzymać punkty za opublikowanie opinii uprawniające do uzyskania rabatu w ramach Programu Punktowego.