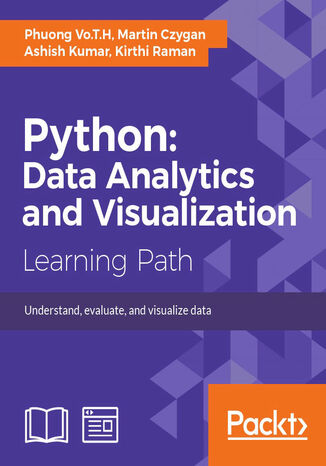
Python: Data Analytics and Visualization. Perform data processing and analysis with the help of python libraries, gain practical insights into predictive modeling and generate effective results in a variety of visually appealing charts using the plotting packages in Python

- Wydawnictwo:
- Packt Publishing
- Ocena:
- Dostępne formaty:
-
PDFePubMobi
Opis ebooka: Python: Data Analytics and Visualization. Perform data processing and analysis with the help of python libraries, gain practical insights into predictive modeling and generate effective results in a variety of visually appealing charts using the plotting packages in Python
After this, you will move on to a data analytics specialization—predictive analytics. Social media and IOT have resulted in an avalanche of data. You will get started with predictive analytics using Python. You will see how to create predictive models from data. You will get balanced information on statistical and mathematical concepts, and implement them in Python using libraries such as Pandas, scikit-learn, and NumPy. You’ll learn more about the best predictive modeling algorithms such as Linear Regression, Decision Tree, and Logistic Regression. Finally, you will master best practices in predictive modeling.
After this, you will get all the practical guidance you need to help you on the journey to effective data visualization. Starting with a chapter on data frameworks, which explains the transformation of data into information and eventually knowledge, this path subsequently cover the complete visualization process using the most popular Python libraries with working examples
This Learning Path combines some of the best that Packt has to offer in one complete, curated package. It includes content from the following Packt products:
? Getting Started with Python Data Analysis, Phuong Vo.T.H &Martin Czygan
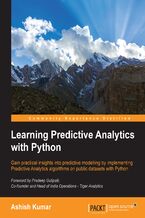
•Learning Predictive Analytics with Python, Ashish Kumar
•Mastering Python Data Visualization, Kirthi Raman
Wybrane bestsellery
Martin Czygan, Phuong Vo.T.H, Ashish Kumar, Kirthi Raman - pozostałe książki
Packt Publishing - inne książki
Dzieki opcji "Druk na żądanie" do sprzedaży wracają tytuły Grupy Helion, które cieszyły sie dużym zainteresowaniem, a których nakład został wyprzedany.
Dla naszych Czytelników wydrukowaliśmy dodatkową pulę egzemplarzy w technice druku cyfrowego.
Co powinieneś wiedzieć o usłudze "Druk na żądanie":
- usługa obejmuje tylko widoczną poniżej listę tytułów, którą na bieżąco aktualizujemy;
- cena książki może być wyższa od początkowej ceny detalicznej, co jest spowodowane kosztami druku cyfrowego (wyższymi niż koszty tradycyjnego druku offsetowego). Obowiązująca cena jest zawsze podawana na stronie WWW książki;
- zawartość książki wraz z dodatkami (płyta CD, DVD) odpowiada jej pierwotnemu wydaniu i jest w pełni komplementarna;
- usługa nie obejmuje książek w kolorze.
Masz pytanie o konkretny tytuł? Napisz do nas: sklep[at]helion.pl.
Książka, którą chcesz zamówić pochodzi z końcówki nakładu. Oznacza to, że mogą się pojawić drobne defekty (otarcia, rysy, zagięcia).
Co powinieneś wiedzieć o usłudze "Końcówka nakładu":
- usługa obejmuje tylko książki oznaczone tagiem "Końcówka nakładu";
- wady o których mowa powyżej nie podlegają reklamacji;
Masz pytanie o konkretny tytuł? Napisz do nas: sklep[at]helion.pl.
Książka drukowana











Oceny i opinie klientów: Python: Data Analytics and Visualization. Perform data processing and analysis with the help of python libraries, gain practical insights into predictive modeling and generate effective results in a variety of visually appealing charts using the plotting packages in Python Martin Czygan, Phuong Vo.T.H, Ashish Kumar, Kirthi Raman (0) Weryfikacja opinii następuję na podstawie historii zamówień na koncie Użytkownika umieszczającego opinię. Użytkownik mógł otrzymać punkty za opublikowanie opinii uprawniające do uzyskania rabatu w ramach Programu Punktowego.